View the data-visualization dashboard portion of the project at: http://foothillcollege.github.io/StemCenterAnalytics
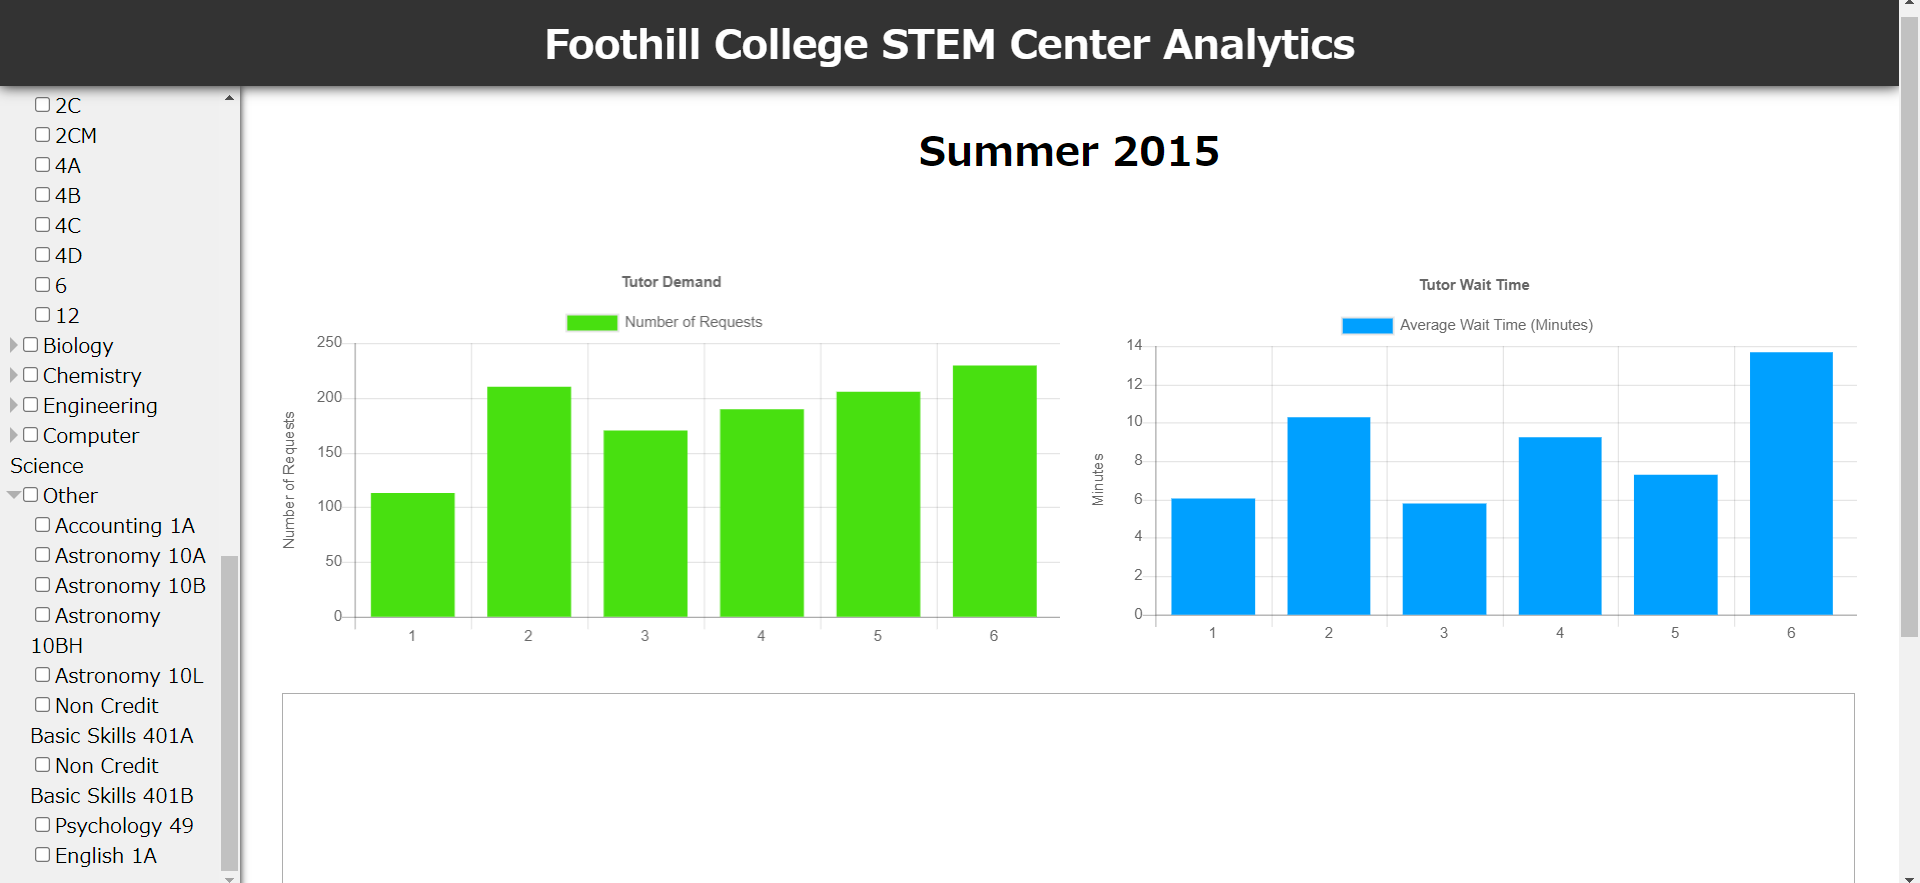
Edit: The above link is no longer active. See the below image for what it looked like in the years it was in service on heroku...:
- The data pipeline is not fully automated on an hourly basis, yet
- Generalized interval/range/course calculation http endpoints
- Statistical functions in the backend API (all the pieces are there, but needs more fleshing out)
- Course selection bar is not yet functional
- Labels are not complete
- Shift to highcharts.js not complete
- Other graphs not yet shown - including a graph similar to that of GitHub's user contributions heatmap