Hi,
thank you for ryour great tool,
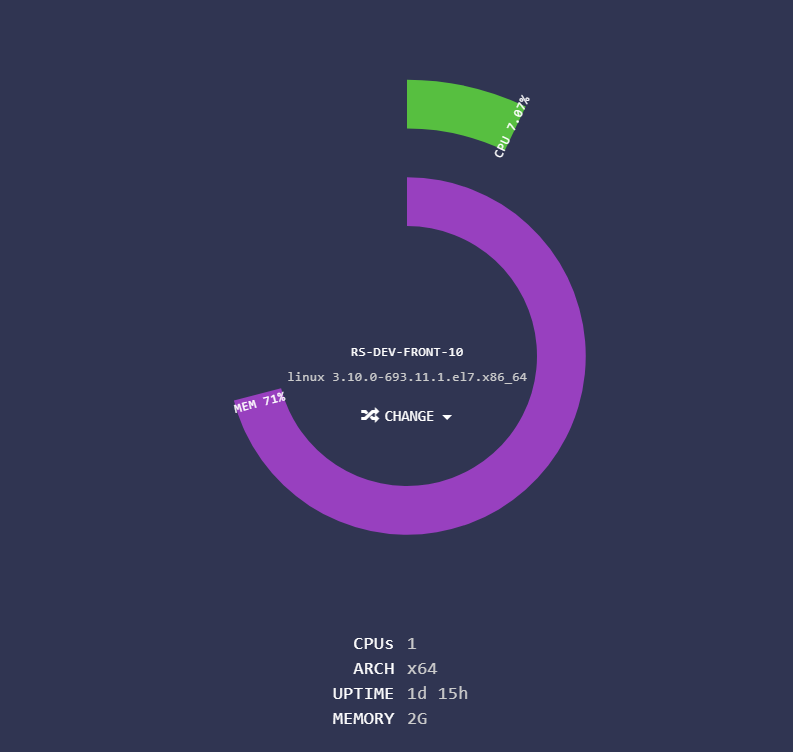
but i think maybe there is error in the web viewer i have this
and in console
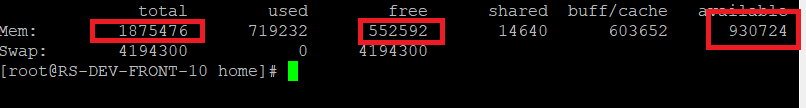
the problem is you are not regarding the available memory , but the free... it is not right because buffer is used by linux when memory not use, and when linux or java or nodejs needs some memory it will take in available and buffer will release his memory, so the graph we seeing not represents the reality....
do you think you could change this ? because i think it is very important we display good information, for example in my example 70 % of memory used is not good, but in reality there are more memory available than used, and graph displays not this but the inverse
i repeat it is a very great tool, beautiful, simple etc.... i want to use it in production !
Hi,
thank you for ryour great tool,
but i think maybe there is error in the web viewer i have this
and in console
the problem is you are not regarding the available memory , but the free... it is not right because buffer is used by linux when memory not use, and when linux or java or nodejs needs some memory it will take in available and buffer will release his memory, so the graph we seeing not represents the reality....
do you think you could change this ? because i think it is very important we display good information, for example in my example 70 % of memory used is not good, but in reality there are more memory available than used, and graph displays not this but the inverse
i repeat it is a very great tool, beautiful, simple etc.... i want to use it in production !