Thank you for this repo - it is really useful.
I have come across an issue with the creation of the xyz points from the zmap file. When creating the xy arrays the points are incorrectly located. I would expect to see the output points in the cell centers. From inspecting the code I think this occurs when inputting the cell edge min_x, max_x etc. values into np.linspace rather than the cell center min and max values. Hopefully the example below illustrates the point and provides a fix.
Here is an example code that reads a zmap file, creates a dataframe of points using .to_pandas() and creating a shapefile from that to view the point locations
from zmapio import ZMAPGrid
import geopandas as gpd
import numpy as np
from shapely.geometry import Point

z_file = ZMAPGrid(os.path.join(environ['USERPROFILE'],'Desktop','UK_DEM.dat')) # read file

df=z_file.to_pandas() # make dataframe
df.dropna(inplace=True) # drop nulls
df['geometry']=df.apply(lambda x: Point(x['X'],x['Y']),axis=1) # make point geoms
df=gpd.GeoDataFrame(df,crs='epsg:4326') # make geodataframe and export as shapefile
df.to_file(os.path.join(environ['USERPROFILE'],'Desktop','UK_DEM_POINTS.shp')) # export shapefile
When plotting the shapefile over the zmap in ArcGIS/QGIS we can see that the points are located in the cell top left in the top left corner:

Near the center in the middle of the zmap:
Point in the bottom right of cell toward the bottom right corner of the zmap:

To make these consistently cell center when creating the x and y meshgrids the code would need to look something like this:
# get cell size
dx=(max_x-min_x)/no_cols
dy=(max_y-min_y)/no_rows
# make arrays of x and y
x = np.linspace(min_x+(dx/2), max_x-(dx/2), no_cols) # shift min value right by 1/2 cell and max value left by 1/2 cell
y = np.linspace(max_y+(dy/2), min_y-(dy/2), no_rows)
# meshgrid
X,Y=np.meshgrid(x,y)
# export dataframe to view points location compared with zmap
center_points=gpd.GeoDataFrame({'X':X.ravel(),'Y':Y.ravel(),'geometry':map(Point,zip(X.ravel(),Y.ravel()))},crs='epsg:4326')
center_points.to_file(os.path.join(environ['USERPROFILE'],'Desktop','UK_DEM_POINTS_CENTER.shp'))
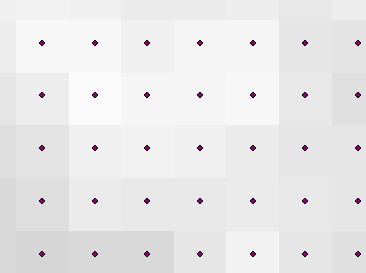
The resultant shapefile of points plotted over the zmap shows the points now placed in cell center. Again the image below is the top left of the zmap.

I hope that is clear. If not let me know.
Many Thanks,
Thank you for this repo - it is really useful.
I have come across an issue with the creation of the xyz points from the zmap file. When creating the xy arrays the points are incorrectly located. I would expect to see the output points in the cell centers. From inspecting the code I think this occurs when inputting the cell edge min_x, max_x etc. values into np.linspace rather than the cell center min and max values. Hopefully the example below illustrates the point and provides a fix.
Here is an example code that reads a zmap file, creates a dataframe of points using .to_pandas() and creating a shapefile from that to view the point locations
When plotting the shapefile over the zmap in ArcGIS/QGIS we can see that the points are located in the cell top left in the top left corner:

Near the center in the middle of the zmap:

Point in the bottom right of cell toward the bottom right corner of the zmap:

To make these consistently cell center when creating the x and y meshgrids the code would need to look something like this:
The resultant shapefile of points plotted over the zmap shows the points now placed in cell center. Again the image below is the top left of the zmap.
I hope that is clear. If not let me know.
Many Thanks,