Hi,
I've tried MOFA with several datatypes, some having ~50 samples while others have 15 or 22 samples.
Here's an overview of the data:

RNA.vst = vst transformed RNA-seq data
DNAm = DNAm m-values
metab_annot_extract = metabolites, cell extract, annotated
metab_annot_secreted = metabolites, cell secretion, annotated
metab_unannot_extract = metabolites, cell extract, unannotated
crispr_qBF = quantile normalized Bayes Factors from CRISPR screens similar to that in Hart et al. 2015, but using a smaller library.
I ran MOFA with the following training options on this data (20 other models were run, most producing similar results, none having a common axis of variation shared between all datatypes)
## $maxiter
## [1] 20000
##
## $tolerance
## [1] 0.02
##
## $DropFactorThreshold
## [1] 0
##
## $verbose
## [1] 0
##
## $seed
## [1] 2020
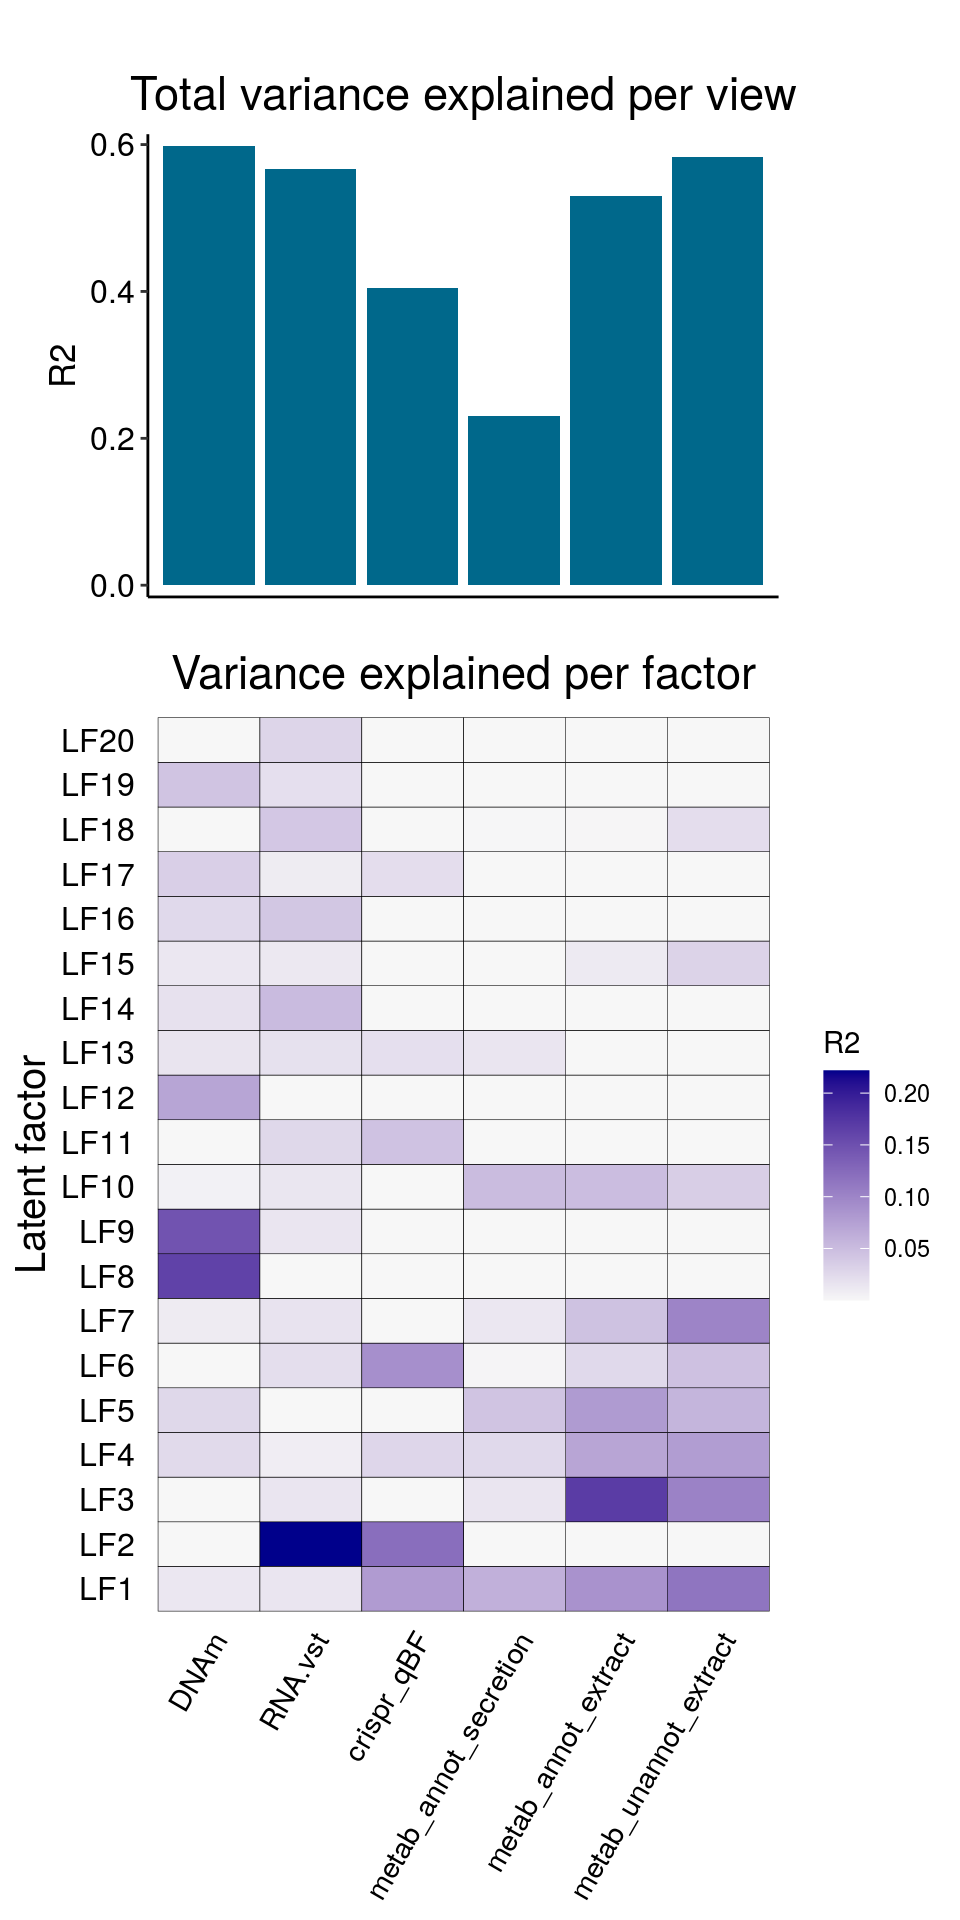
The resulting model has the following explained variance:
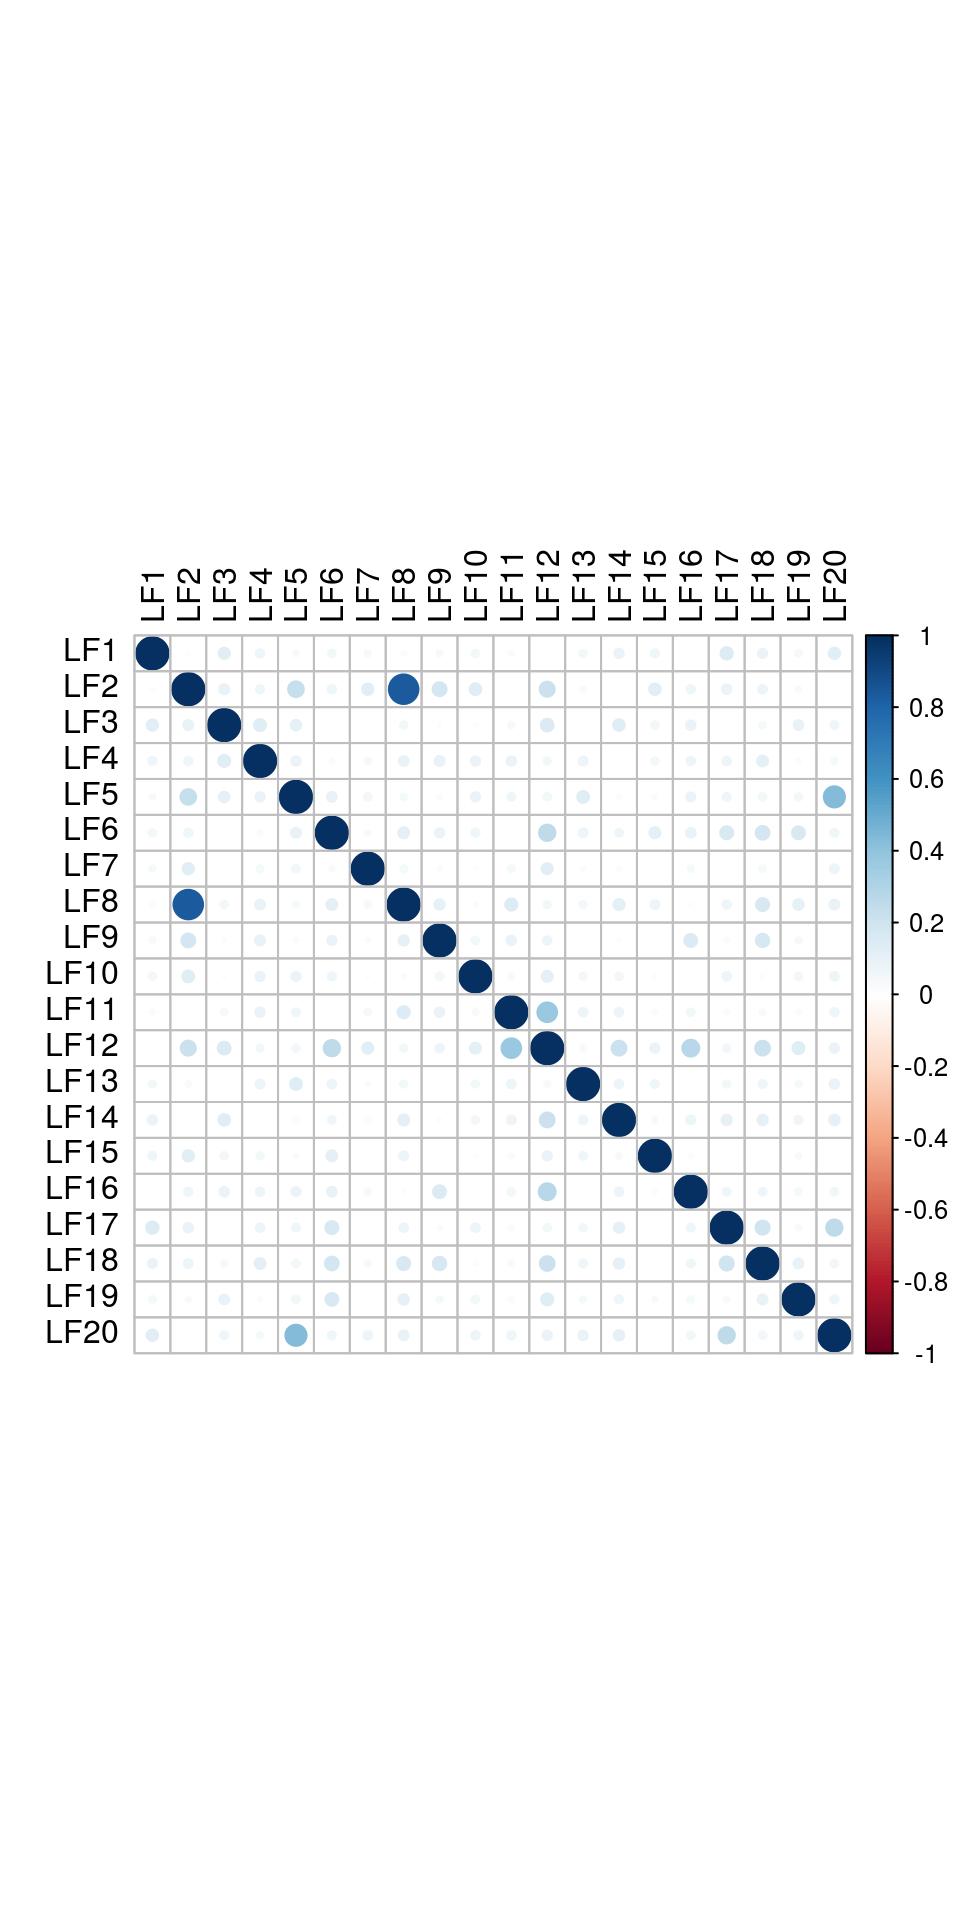
and correlattion between factors:
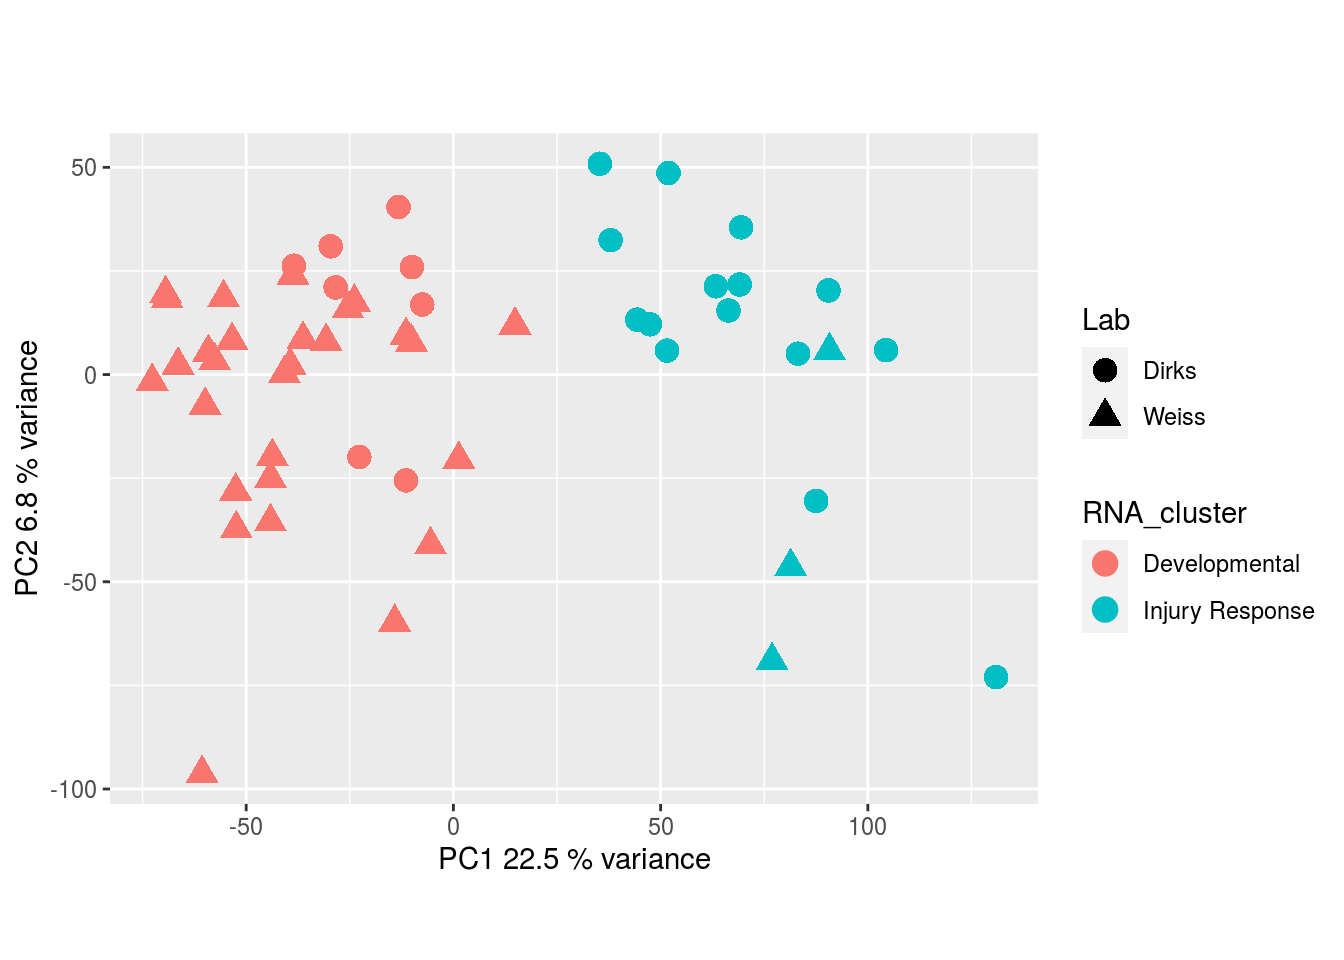
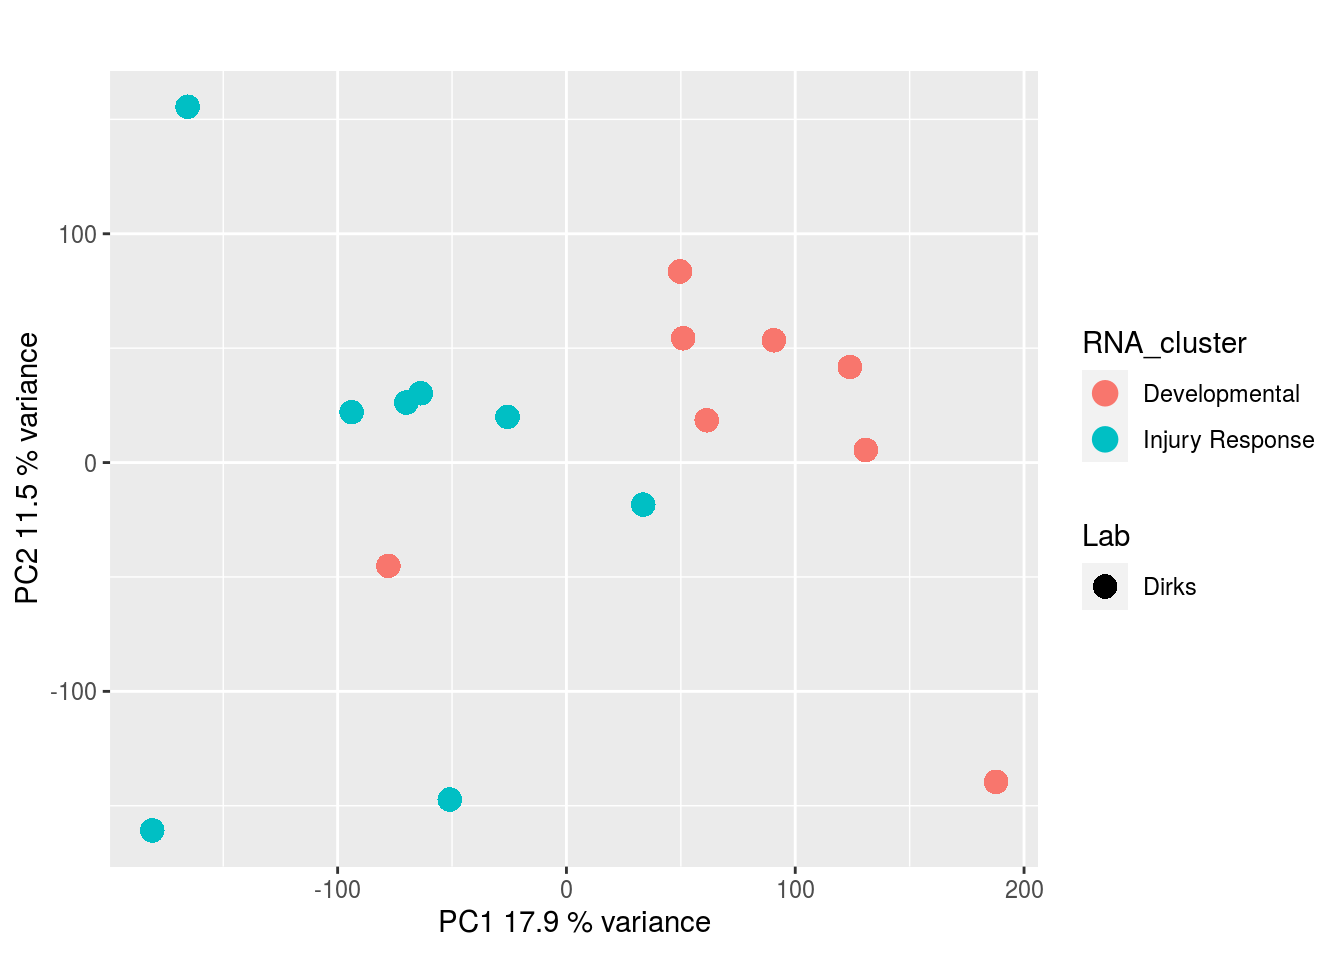
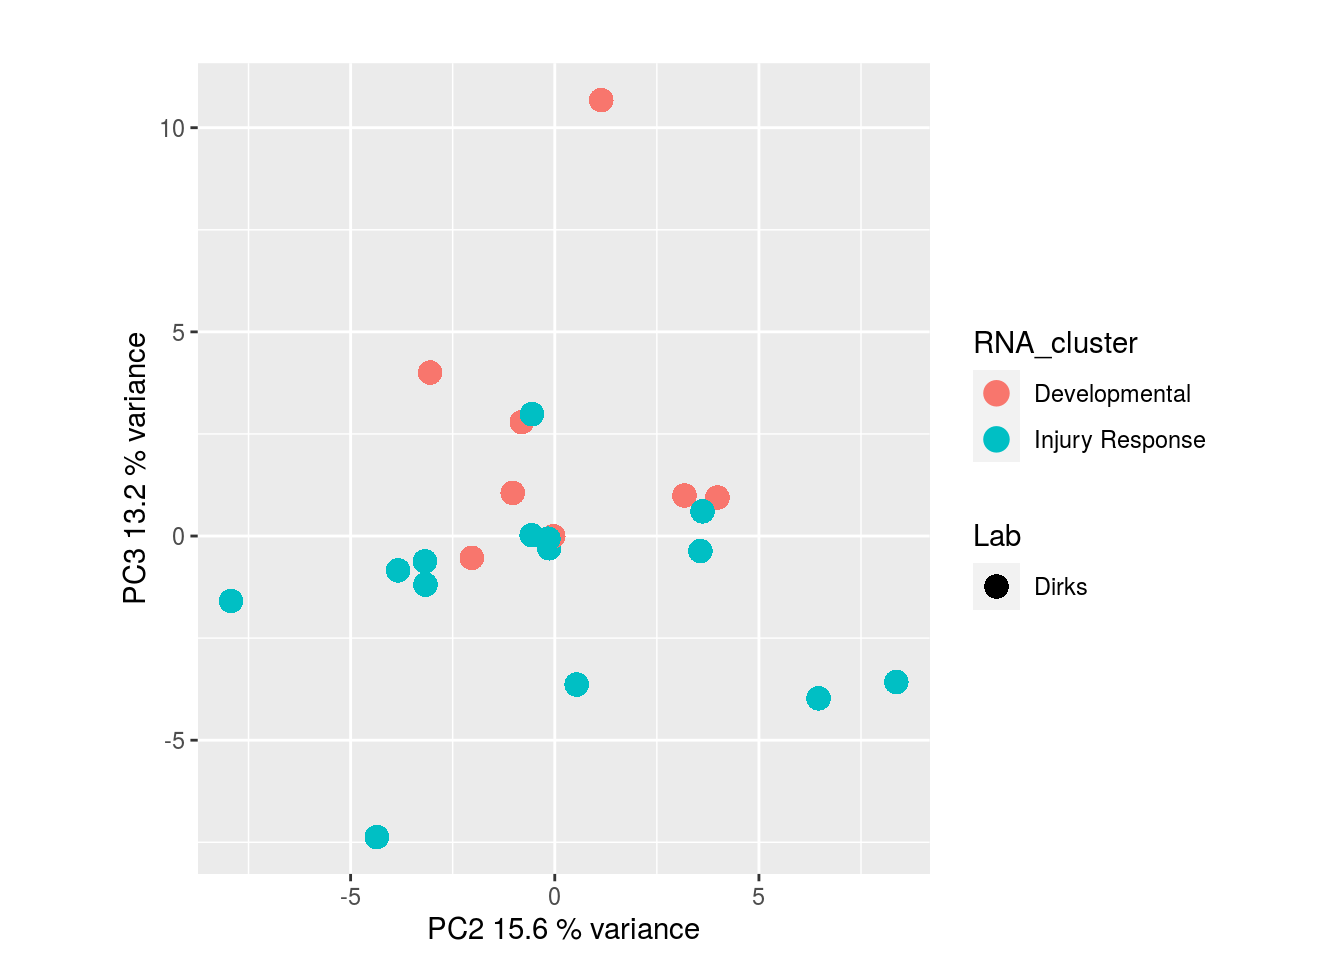
The results would seem to imply that metabolomics data do not share a common axis with the RNA-seq and DNA methylation data. When I run PCA on eahc of the data matrices as input to MOFA individually however, I get clean or relatively clean separation of clusters identified in RNA-seq data in each datatype:
RNA-seq:
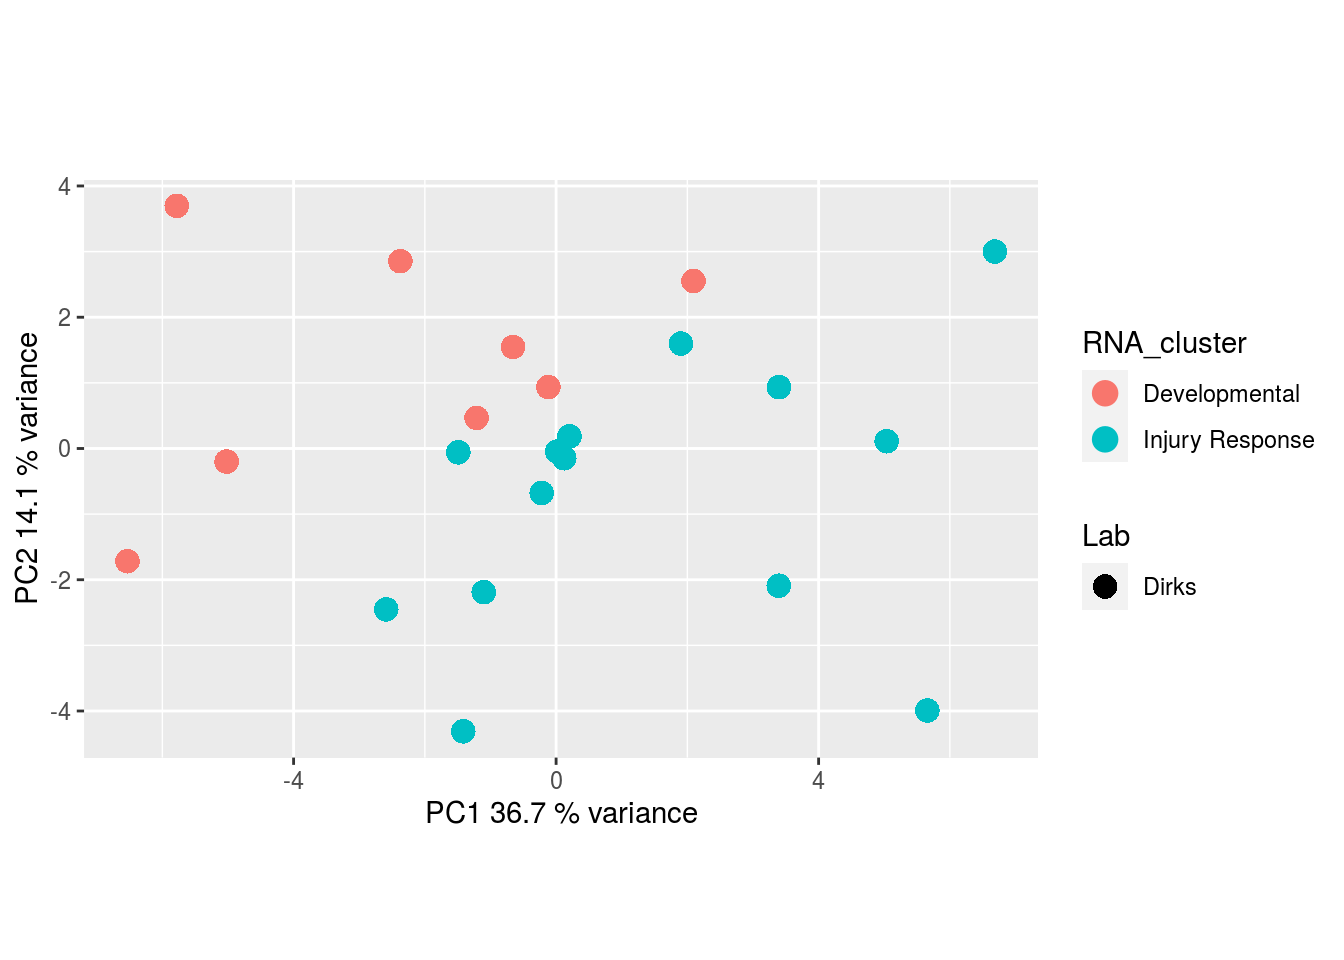
DNA methylation:
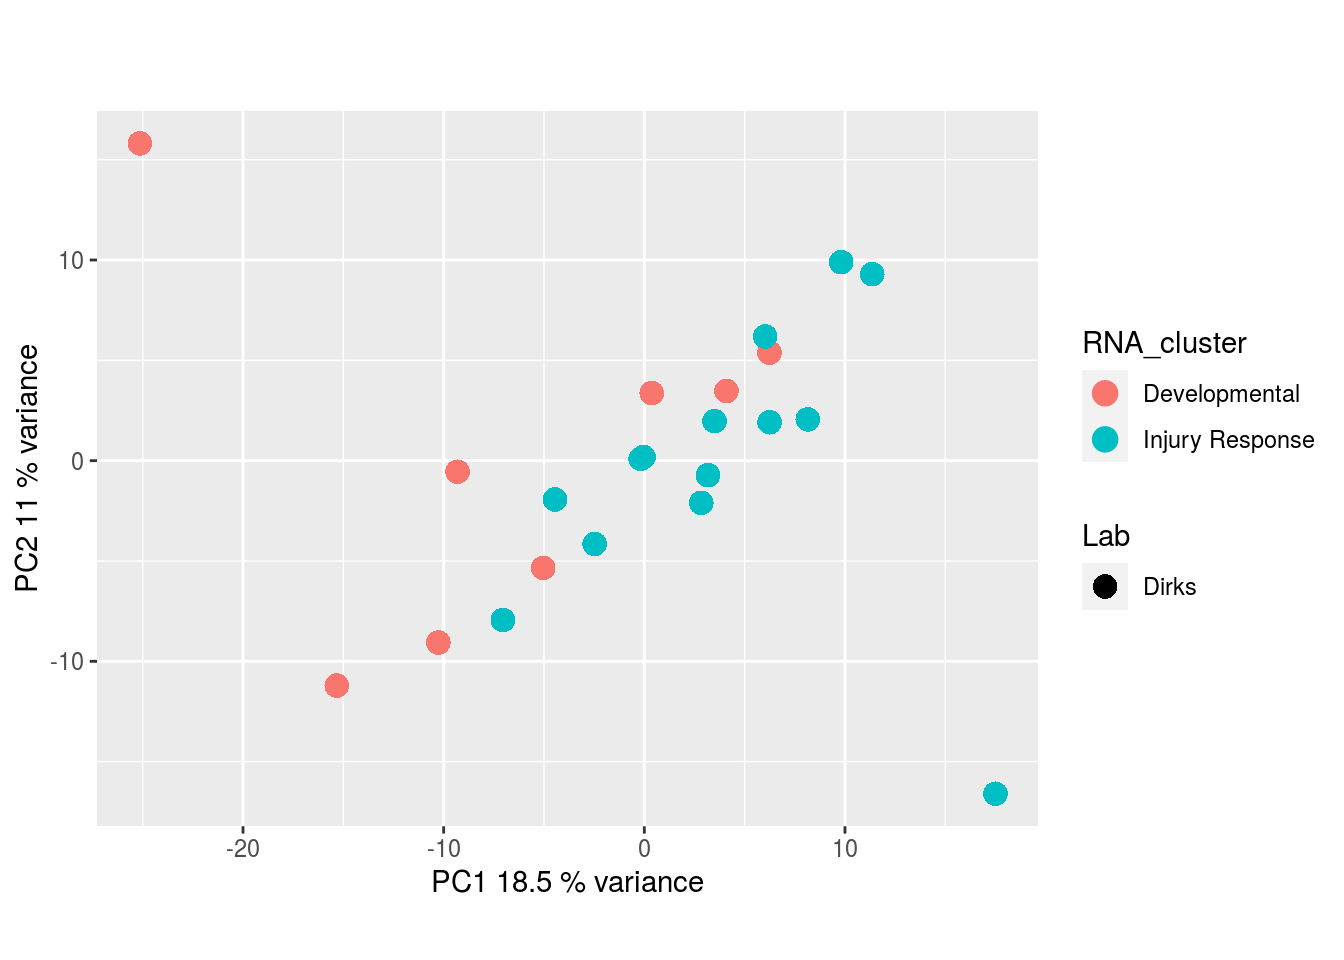
CRISPR Screen:
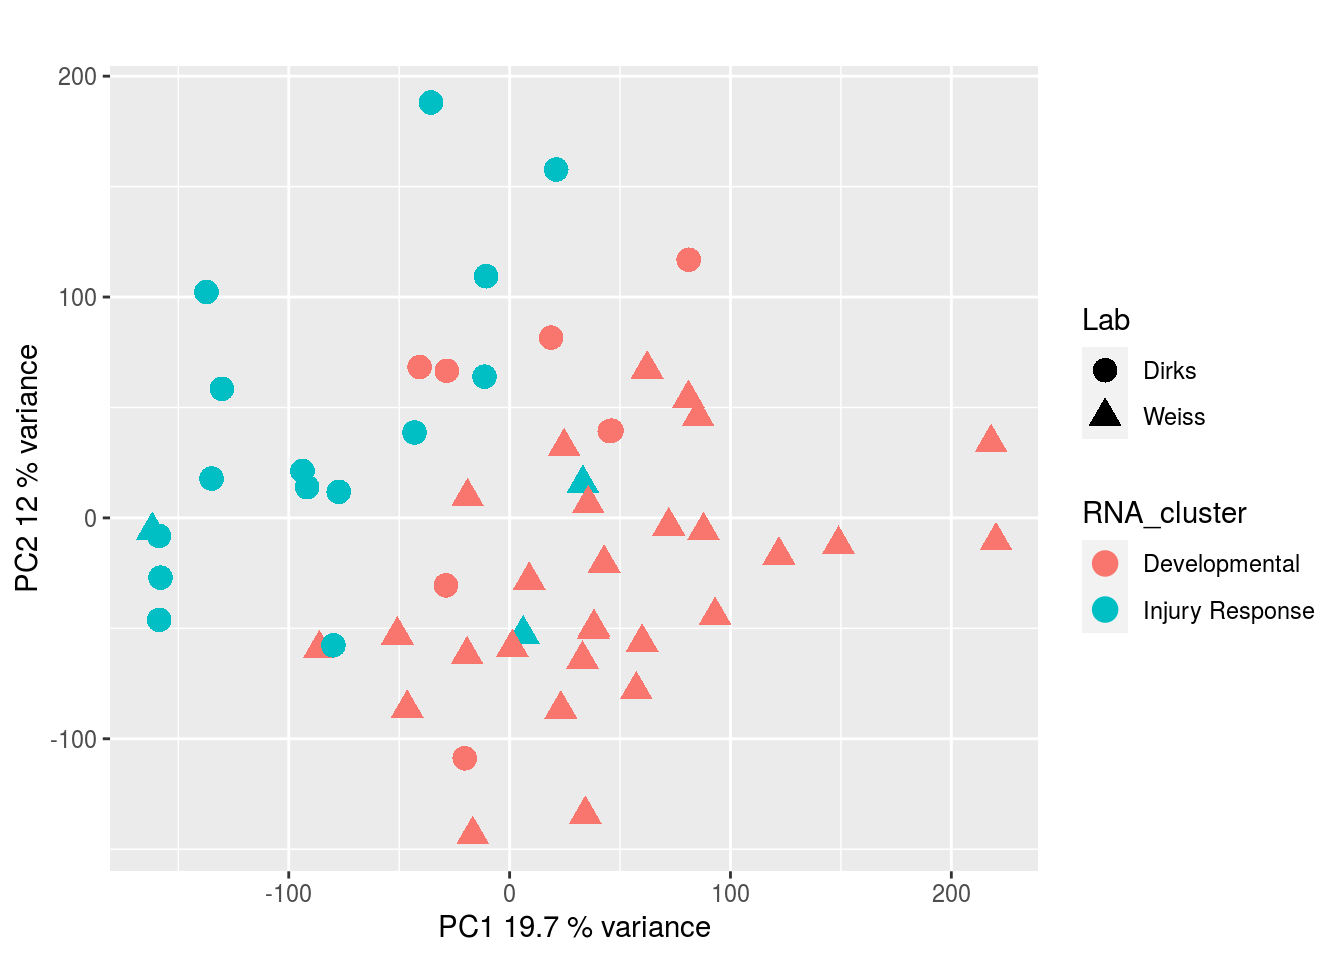
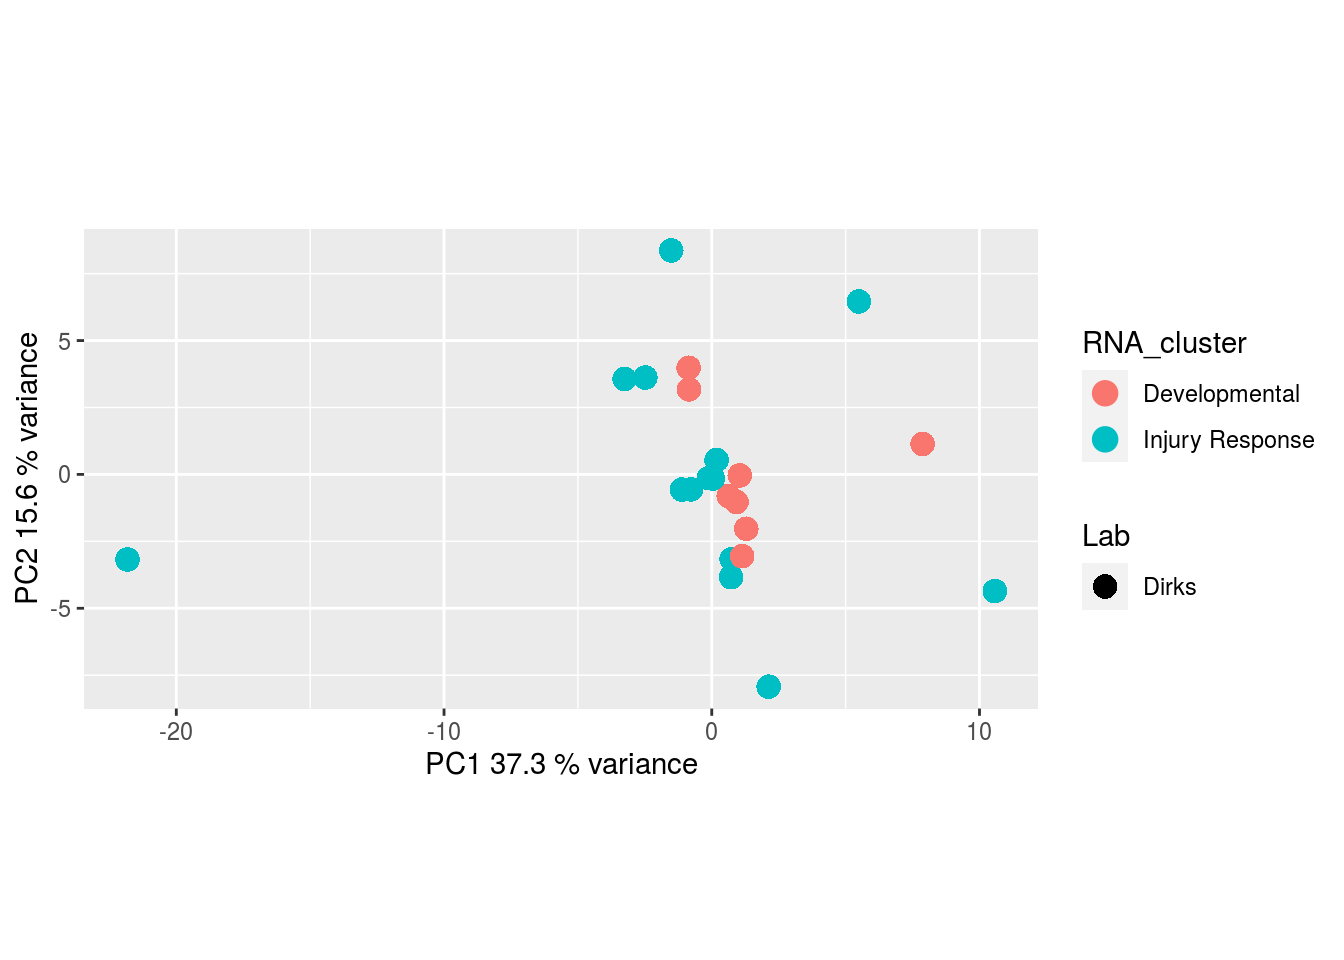
Metabolites, Annotated Cell Extract:
Metabolites, Unannotated Cell Extract:

Metabolites, Annotated Secretion:
I would have expected a common factor to be found for all datatypes, but I'm wondering if there's too much missing data here.
Session Info:
## R version 3.5.2 (2018-12-20)
## Platform: x86_64-pc-linux-gnu (64-bit)
## Running under: Ubuntu 16.04.6 LTS
##
## Matrix products: default
## BLAS: /usr/lib/libblas/libblas.so.3.6.0
## LAPACK: /usr/lib/lapack/liblapack.so.3.6.0
##
## locale:
##  [1] LC_CTYPE=en_CA.UTF-8       LC_NUMERIC=C
##  [3] LC_TIME=en_CA.UTF-8        LC_COLLATE=en_CA.UTF-8
##  [5] LC_MONETARY=en_CA.UTF-8    LC_MESSAGES=en_CA.UTF-8
##  [7] LC_PAPER=en_CA.UTF-8       LC_NAME=C
##  [9] LC_ADDRESS=C               LC_TELEPHONE=C
## [11] LC_MEASUREMENT=en_CA.UTF-8 LC_IDENTIFICATION=C
##
## attached base packages:
## [1] parallel  stats4    stats     graphics  grDevices utils     datasets
## [8] methods   base
##
## other attached packages:
##  [1] reticulate_1.15             ggplot2_3.3.0
##  [3] pheatmap_1.0.12             su2cproj_0.1.034
##  [5] MultiAssayExperiment_1.8.3  SummarizedExperiment_1.12.0
##  [7] DelayedArray_0.8.0          BiocParallel_1.16.6
##  [9] matrixStats_0.55.0          Biobase_2.42.0
## [11] GenomicRanges_1.34.0        GenomeInfoDb_1.18.2
## [13] IRanges_2.16.0              S4Vectors_0.20.1
## [15] BiocGenerics_0.28.0         MOFA_1.3.1
##
## loaded via a namespace (and not attached):
##  [1] ggrepel_0.8.2          Rcpp_1.0.4.6           lattice_0.20-38
##  [4] assertthat_0.2.1       digest_0.6.25          foreach_1.5.0
##  [7] R6_2.4.1               plyr_1.8.6             evaluate_0.14
## [10] highr_0.8              pillar_1.4.4           zlibbioc_1.28.0
## [13] rlang_0.4.6            Matrix_1.2-18          rmarkdown_2.1
## [16] labeling_0.3           stringr_1.4.0          RCurl_1.98-1.2
## [19] munsell_0.5.0          compiler_3.5.2         vipor_0.4.5
## [22] xfun_0.12              pkgconfig_2.0.3        ggbeeswarm_0.6.0
## [25] htmltools_0.4.0        tidyselect_1.0.0       tibble_3.0.1
## [28] GenomeInfoDbData_1.2.0 codetools_0.2-15       reshape_0.8.8
## [31] withr_2.2.0            crayon_1.3.4           dplyr_0.8.5
## [34] rappdirs_0.3.1         bitops_1.0-6           grid_3.5.2
## [37] GGally_1.4.0           jsonlite_1.6.1         gtable_0.3.0
## [40] lifecycle_0.2.0        magrittr_1.5           scales_1.1.1
## [43] stringi_1.4.6          farver_2.0.3           XVector_0.22.0
## [46] reshape2_1.4.3         doParallel_1.0.15      ellipsis_0.3.1
## [49] vctrs_0.3.0            cowplot_1.0.0          Rhdf5lib_1.4.3
## [52] RColorBrewer_1.1-2     iterators_1.0.12       tools_3.5.2
## [55] glue_1.4.1             beeswarm_0.2.3         purrr_0.3.3
## [58] yaml_2.2.1             rhdf5_2.26.2           colorspace_1.4-1
## [61] corrplot_0.84          knitr_1.28
Hi,
I've tried MOFA with several datatypes, some having ~50 samples while others have 15 or 22 samples.
Here's an overview of the data:
RNA.vst = vst transformed RNA-seq data
DNAm = DNAm m-values
metab_annot_extract = metabolites, cell extract, annotated
metab_annot_secreted = metabolites, cell secretion, annotated
metab_unannot_extract = metabolites, cell extract, unannotated
crispr_qBF = quantile normalized Bayes Factors from CRISPR screens similar to that in Hart et al. 2015, but using a smaller library.
I ran MOFA with the following training options on this data (20 other models were run, most producing similar results, none having a common axis of variation shared between all datatypes)
The resulting model has the following explained variance:

and correlattion between factors:

The results would seem to imply that metabolomics data do not share a common axis with the RNA-seq and DNA methylation data. When I run PCA on eahc of the data matrices as input to MOFA individually however, I get clean or relatively clean separation of clusters identified in RNA-seq data in each datatype:
RNA-seq:

DNA methylation:

CRISPR Screen:

Metabolites, Annotated Cell Extract:

Metabolites, Unannotated Cell Extract:

Metabolites, Annotated Secretion:


I would have expected a common factor to be found for all datatypes, but I'm wondering if there's too much missing data here.
Session Info: