Display simulated parameters in a uitable #5
Description
@ZiqNas I'd suggest that the parameters that produce the best fitting to be displayed in a uitable. Take the n, k and d values for every layer and put it into a cell, then put the cell into a uitable:
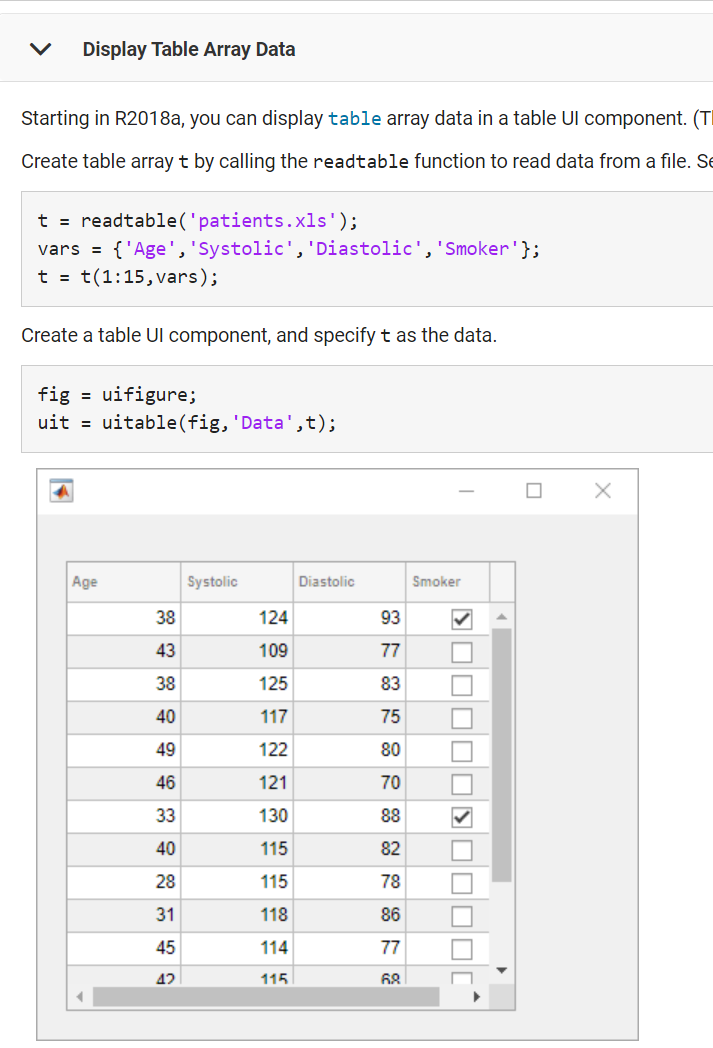
https://www.mathworks.com/help/matlab/ref/uitable.html
I think it's neater this way. Please try this.