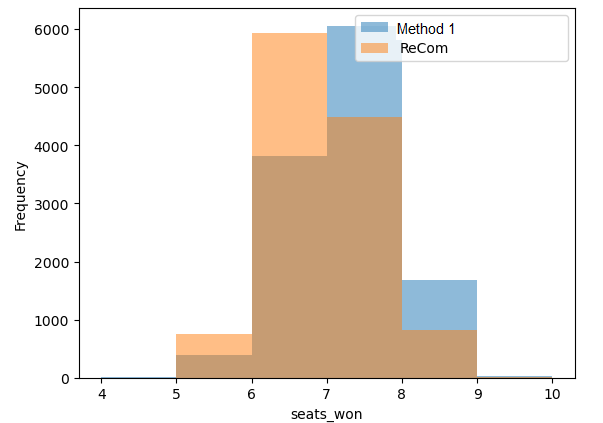
If a user runs two chains, I think it's nice/helpful for them to be able to compare the results of those chains on the same boxplot/histogram to see how tweaking different options / how different chain properties result in potentially different distributions for various scores (e.g., cut_edges, efficiency gap, etc.). We could start by allowing them to plot up to 2 chains on the same histogram/boxplot, or we could even allow them to plot an arbitrary n number of chains. (I have a (bad) prototype of this written up somewhere in a Jupyter notebook, contact me for it!)
Here's an example:
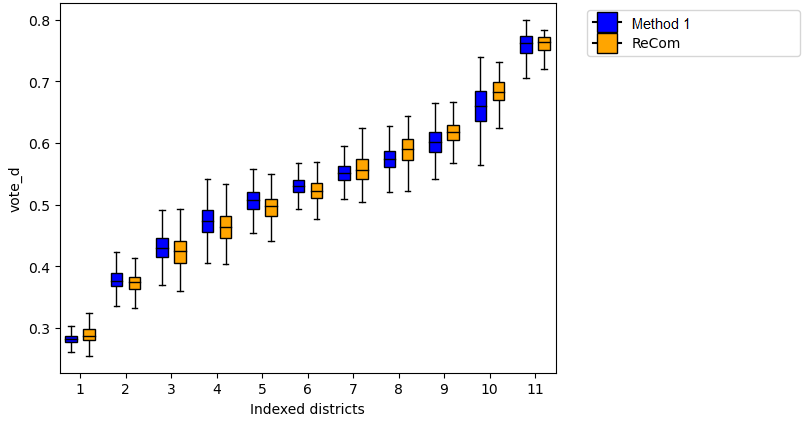
