You signed in with another tab or window. Reload to refresh your session.You signed out in another tab or window. Reload to refresh your session.You switched accounts on another tab or window. Reload to refresh your session.Dismiss alert
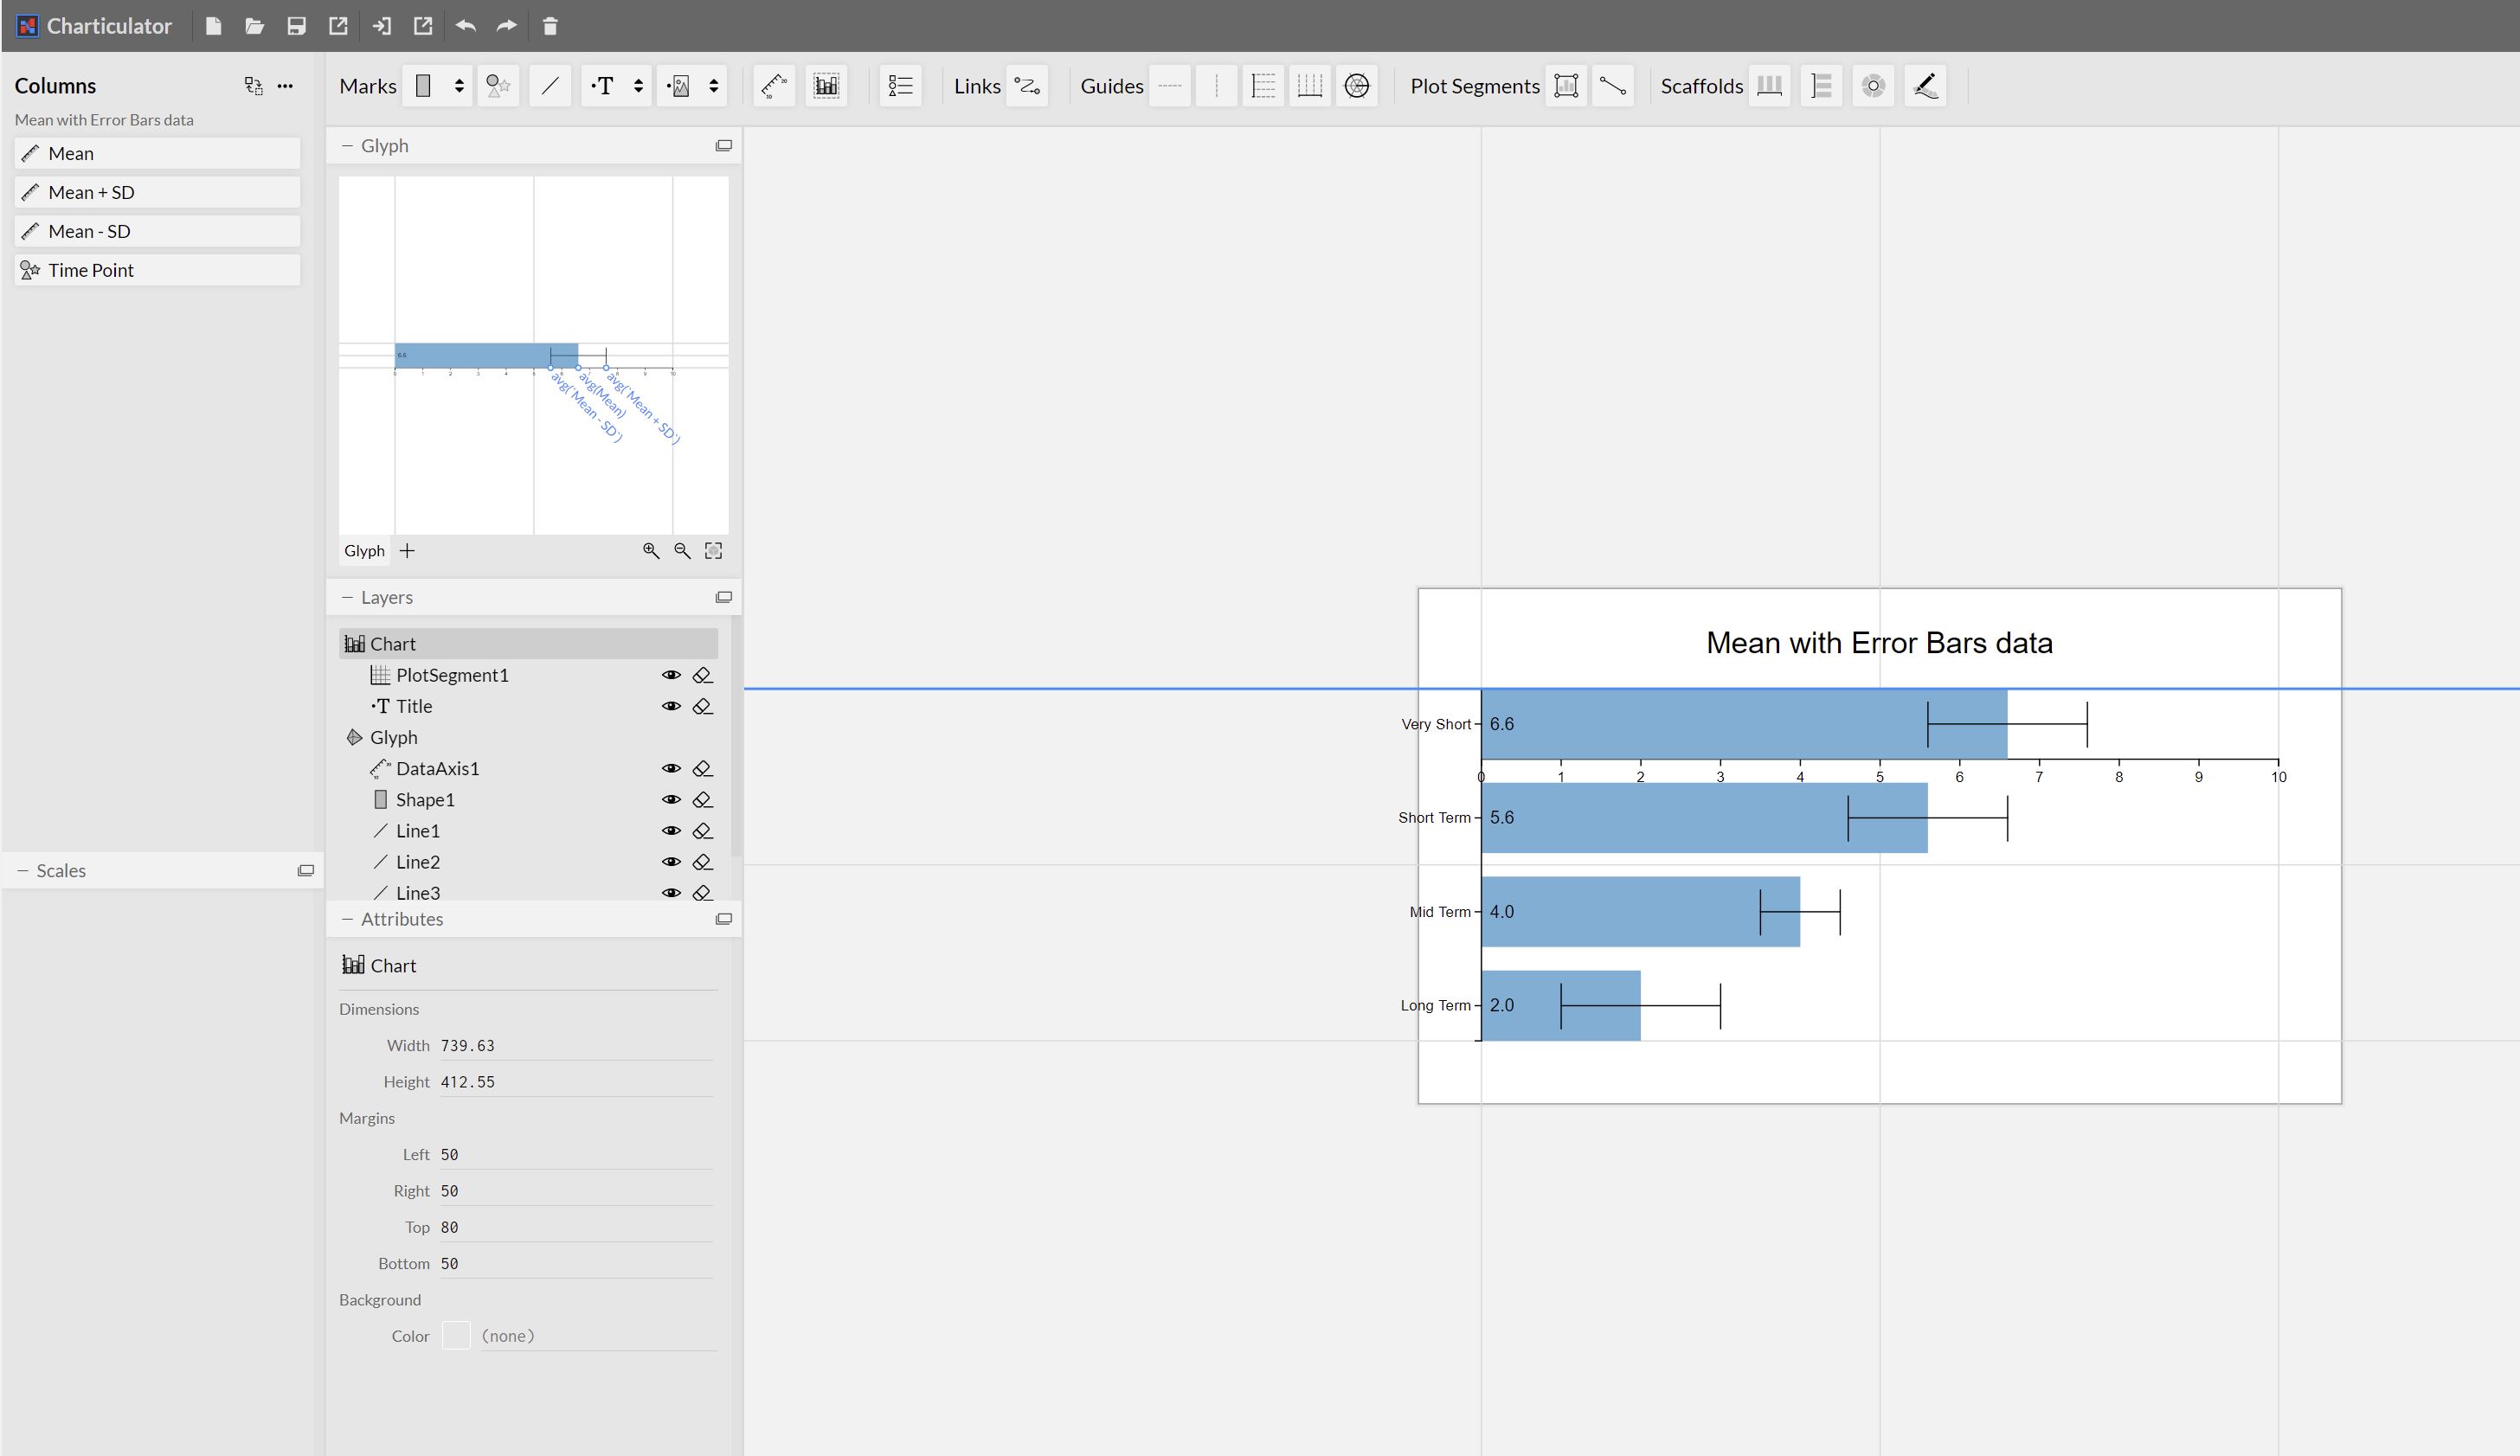
I'm trying to make a Dynamite plot - mean values with whiskers for mean values +/- Standard deviations, - I followed the tutorial here: https://charticulator.com/tutorials/tutorial9.html (Bar Chart with Error bars) but there's a strange glitch.
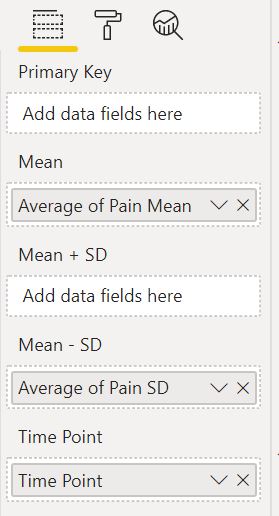
I am unable to place any value in the "Mean + SD" field well.
The available field wells are mean, Mean - SD, Mean +SD (along with Primary Key)
At first I thought this was because I was using measures (which calculate weighted means for these values), but I've also tried this using columns from the source table, and the same problem exists.
I have tried horizontal as well as vertical bars, and double checked each step from the tutorial, all to no avail.
I'm trying to make a Dynamite plot - mean values with whiskers for mean values +/- Standard deviations, - I followed the tutorial here: https://charticulator.com/tutorials/tutorial9.html (Bar Chart with Error bars) but there's a strange glitch.
I am unable to place any value in the "Mean + SD" field well.
The available field wells are mean, Mean - SD, Mean +SD (along with Primary Key)
At first I thought this was because I was using measures (which calculate weighted means for these values), but I've also tried this using columns from the source table, and the same problem exists.
I have tried horizontal as well as vertical bars, and double checked each step from the tutorial, all to no avail.
Here's the .pbviz file: https://1drv.ms/u/s!AgytcDfT4DRFj_kGVfnpM5J89BjqLQ?e=aceqsK and here's a screen capture from both the final Charticulator output, and the available field wells:
Thanks in advance for any help,
Rod