First noticed in phetsims/calculus-grapher#256.
If plots are stroked and filled with different colors, then the current implementation of ScatterPlot does not behave as desired when points overlap.
For example, here's a case where the points have stroke: 'red' and fill: 'yellow'. Note that points that overlap the x-axis (black horizontal line) in this example behave as desired - they look filled. Points that overlap other points do not behave as desired; they look like you can see through the points.
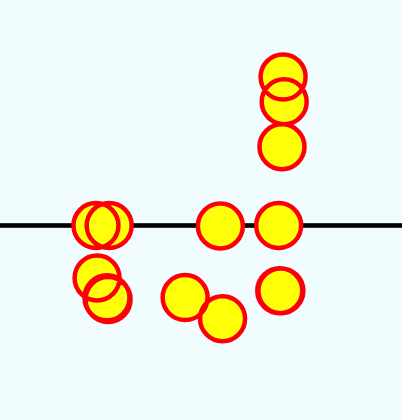
The cause of this undesirable rendering behavior is that ScatterPlot uses Path+Shape to draw the points. The lines of the Shape are stroked, then the interior areas of the Shape are filled. The relevant code is in ScatterPlot update:
        shape.moveTo( viewPoint.x + this.radius, viewPoint.y ); // need to move to where circle actually starts
        shape.circle( viewPoint.x, viewPoint.y, this.radius );
After consulting with @samreid and @jonathanolson, we were unable to fix this implementation. We considered changing ScatterPlot to draw a set of scenery.Circle instances, but that is not scalable, so not an appropriate approach for bamboo.
For phetsims/calculus-grapher#256, we decided to choose one of these workaround options:
(1) Live with the problem, because the number of overlapping points may turn out to be small.
(2) Since we may have a small number of points, create something sim-specific that uses scenery.Circle.
(3) Create CanvasScatterPlot that uses the Canvas API.
As of this writing, we are leaning towards (1) or (2). EDIT: We chose (2), see DiscontinuousPointsPlot.
First noticed in phetsims/calculus-grapher#256.
If plots are stroked and filled with different colors, then the current implementation of ScatterPlot does not behave as desired when points overlap.
For example, here's a case where the points have
stroke: 'red'andfill: 'yellow'. Note that points that overlap the x-axis (black horizontal line) in this example behave as desired - they look filled. Points that overlap other points do not behave as desired; they look like you can see through the points.The cause of this undesirable rendering behavior is that ScatterPlot uses Path+Shape to draw the points. The lines of the Shape are stroked, then the interior areas of the Shape are filled. The relevant code is in ScatterPlot
update:After consulting with @samreid and @jonathanolson, we were unable to fix this implementation. We considered changing ScatterPlot to draw a set of scenery.Circle instances, but that is not scalable, so not an appropriate approach for bamboo.
For phetsims/calculus-grapher#256, we decided to choose one of these workaround options:
(1) Live with the problem, because the number of overlapping points may turn out to be small.
(2) Since we may have a small number of points, create something sim-specific that uses scenery.Circle.
(3) Create CanvasScatterPlot that uses the Canvas API.
As of this writing, we are leaning towards (1) or (2). EDIT: We chose (2), see
DiscontinuousPointsPlot.