| title | 1 Basic Principles of VChart |
|---|---|
| key words | VisActor,VChart,VTable,VStrory,VMind,VGrammar,VRender,Visualization,Chart,Data,Table,Graph,Gis,LLM |
-
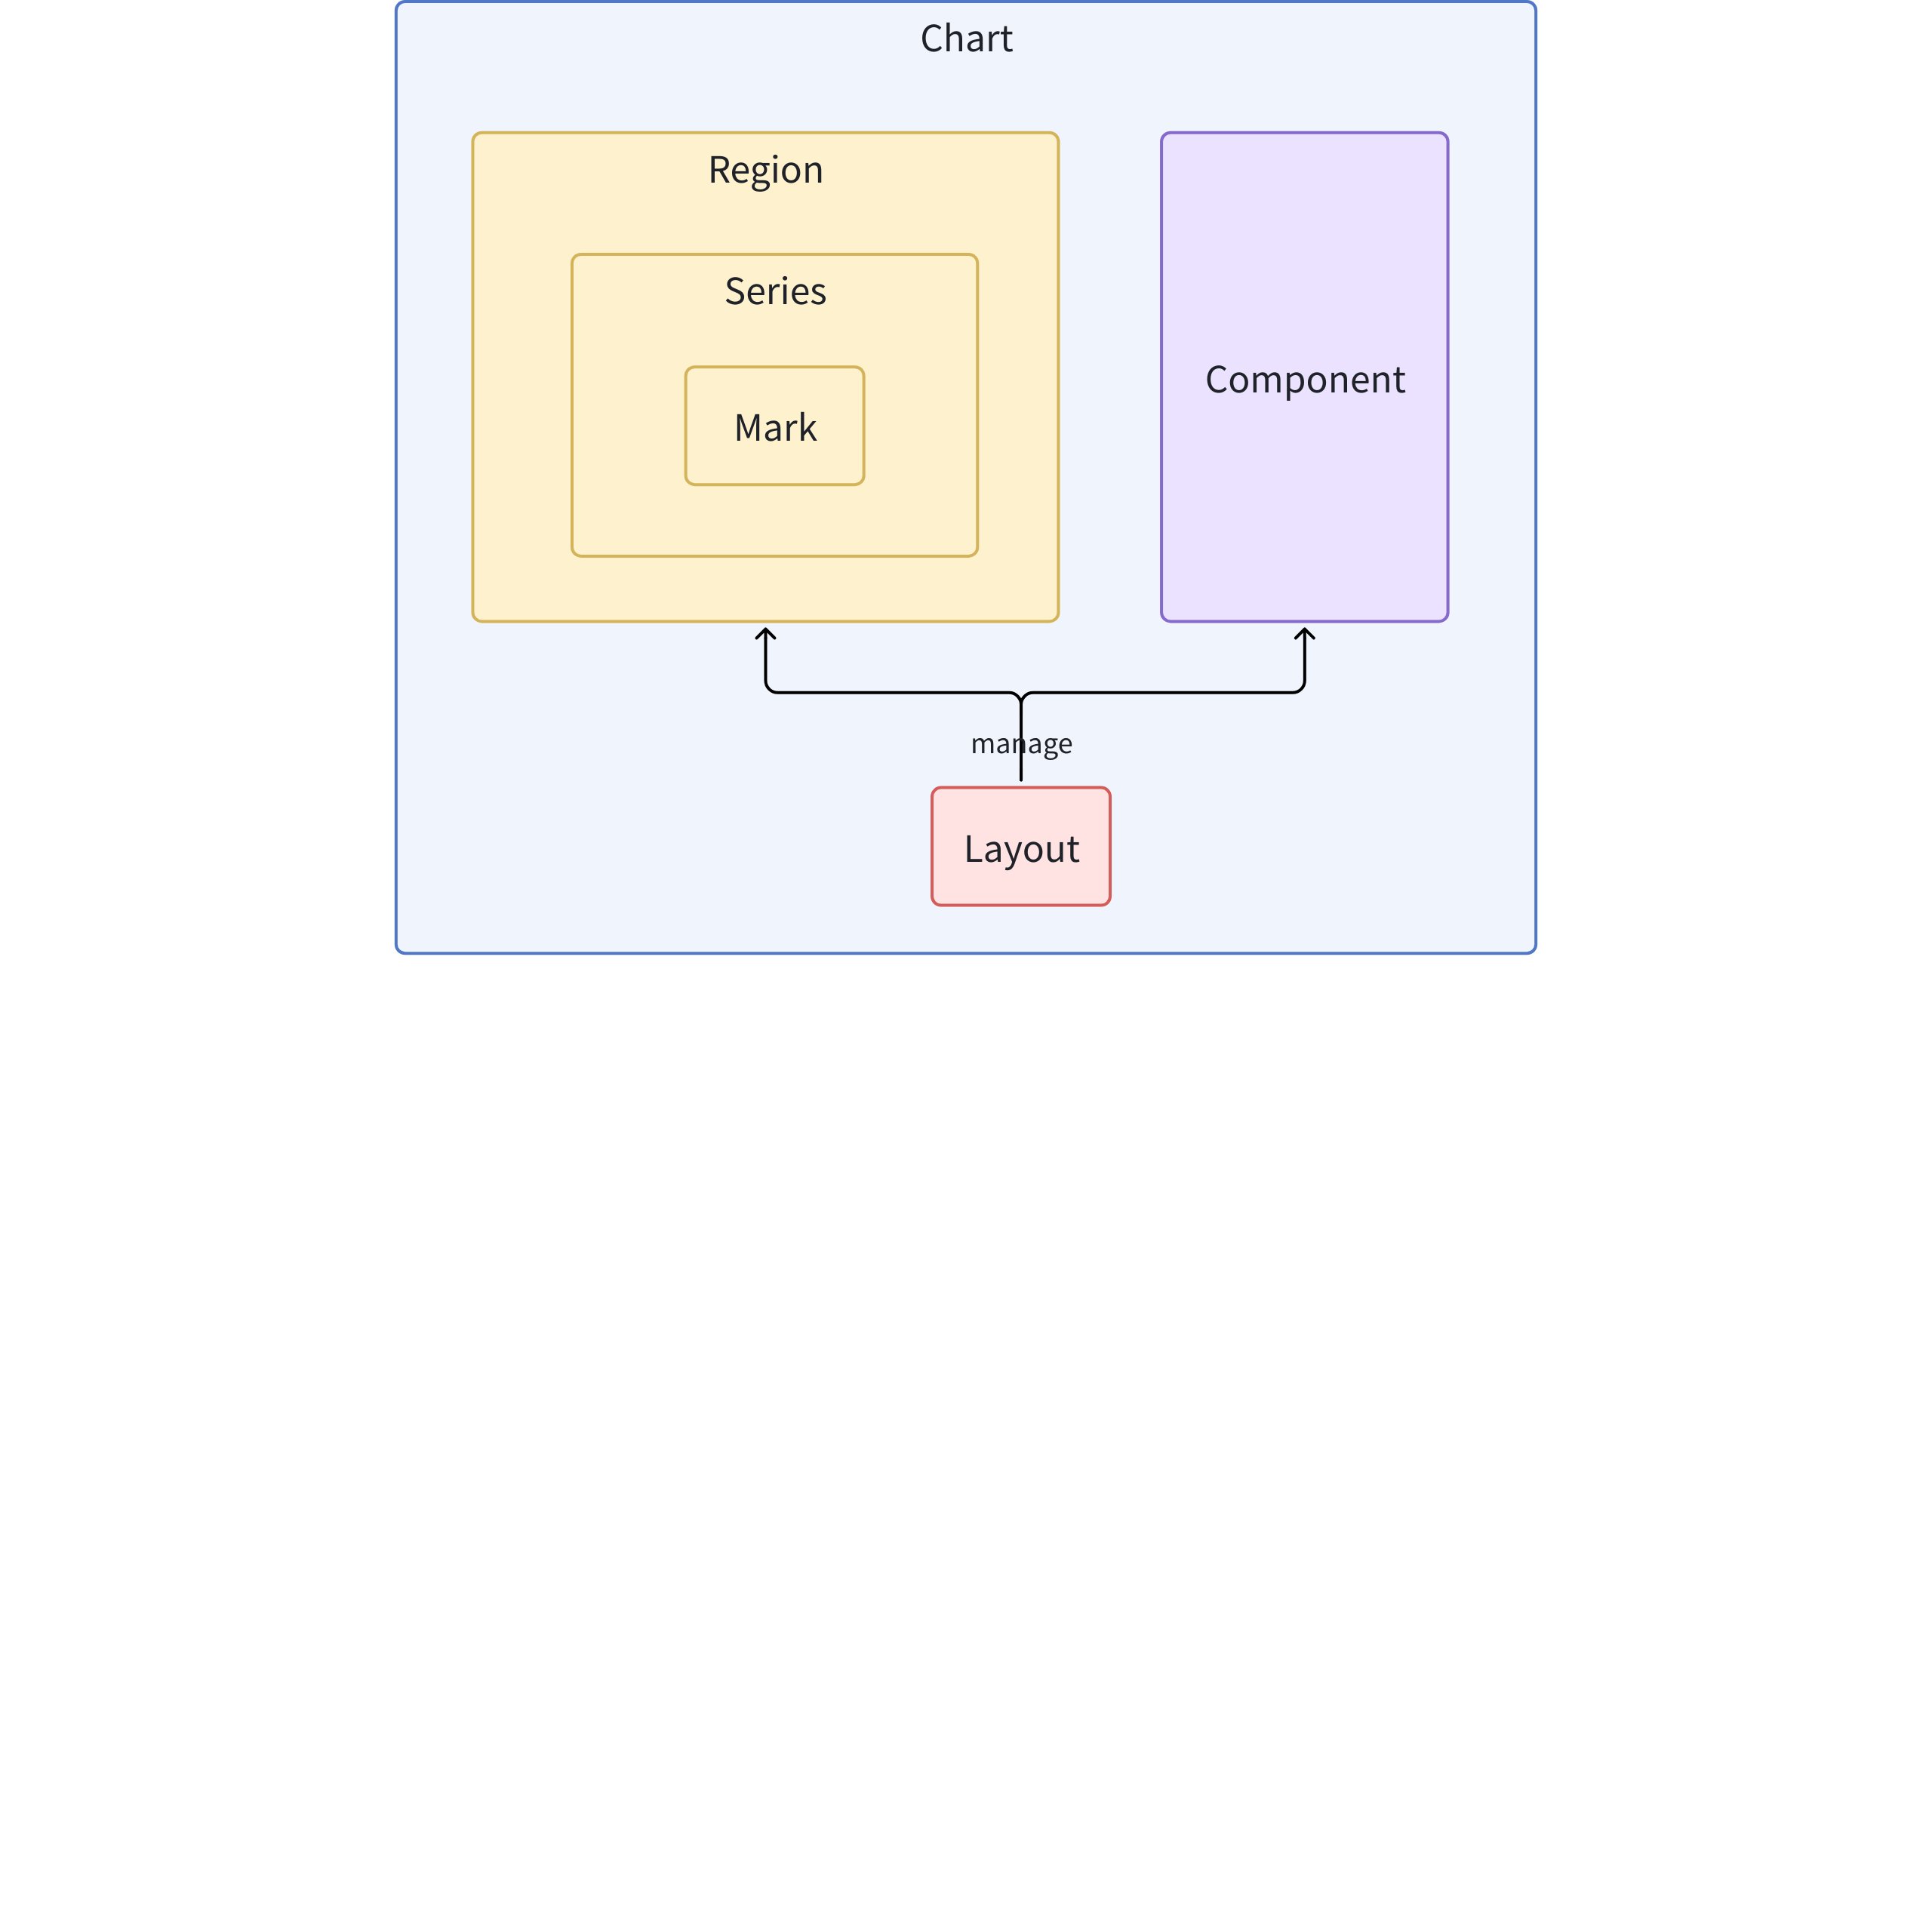
Mark: Basic graphical elements (basic primitives), such as lines, points, rectangles, etc.
-
Series: Responsible for the visual representation of a specific type of data, containing a set of primitives and their corresponding chart logic, such as a series of lines in a line chart
-
Region: Defines the spatial area of the chart, associates one or more series, handles interactions and animations, and provides coordinate systems
-
Component: Components that assist in chart reading and interaction, such as legends, axes, tooltips, etc.
-
Layout: Manages the layout of the chart, including the position and size of regions and components
-
Chart: The abstract concept of the entire chart, containing elements on the view such as layout, components, and regions, as well as data and all elements required to form a chart
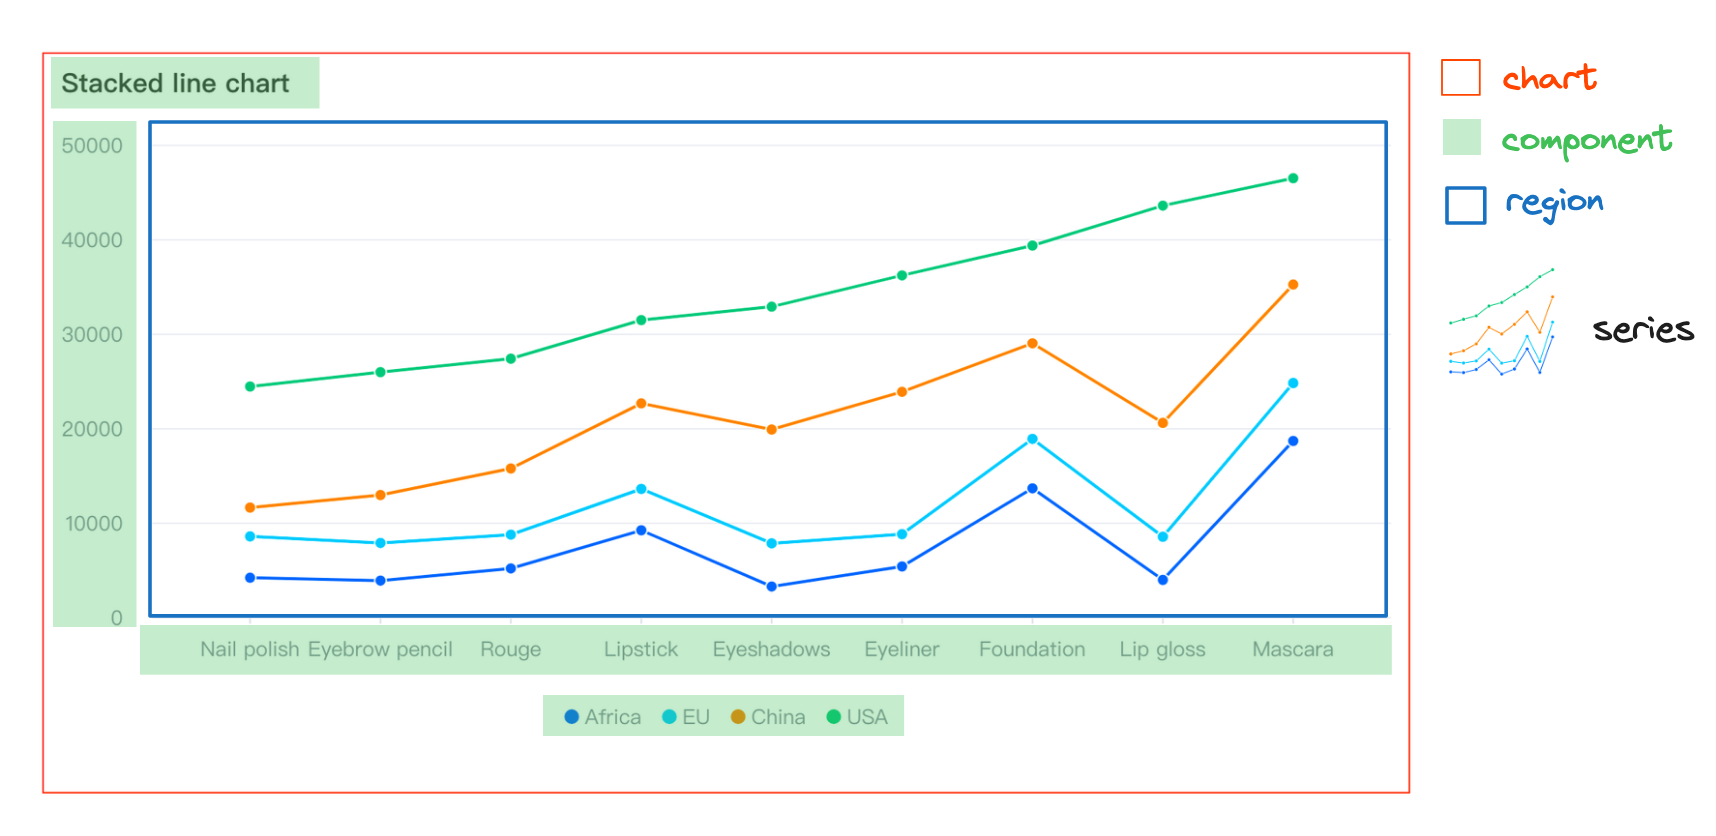
The above image is a composite chart, simply put, it has multiple series groups, with bar and line series groups above.
-
If we do not configure specifically, all series will be associated with one region, so they will overlap and share certain coordinates.
-
Each series can have its own data source, or the data source can be configured directly on the chart. In the series, it is associated through
fromDataIdorfromDataIndex. In the current example, we choose to configure it on the chart.
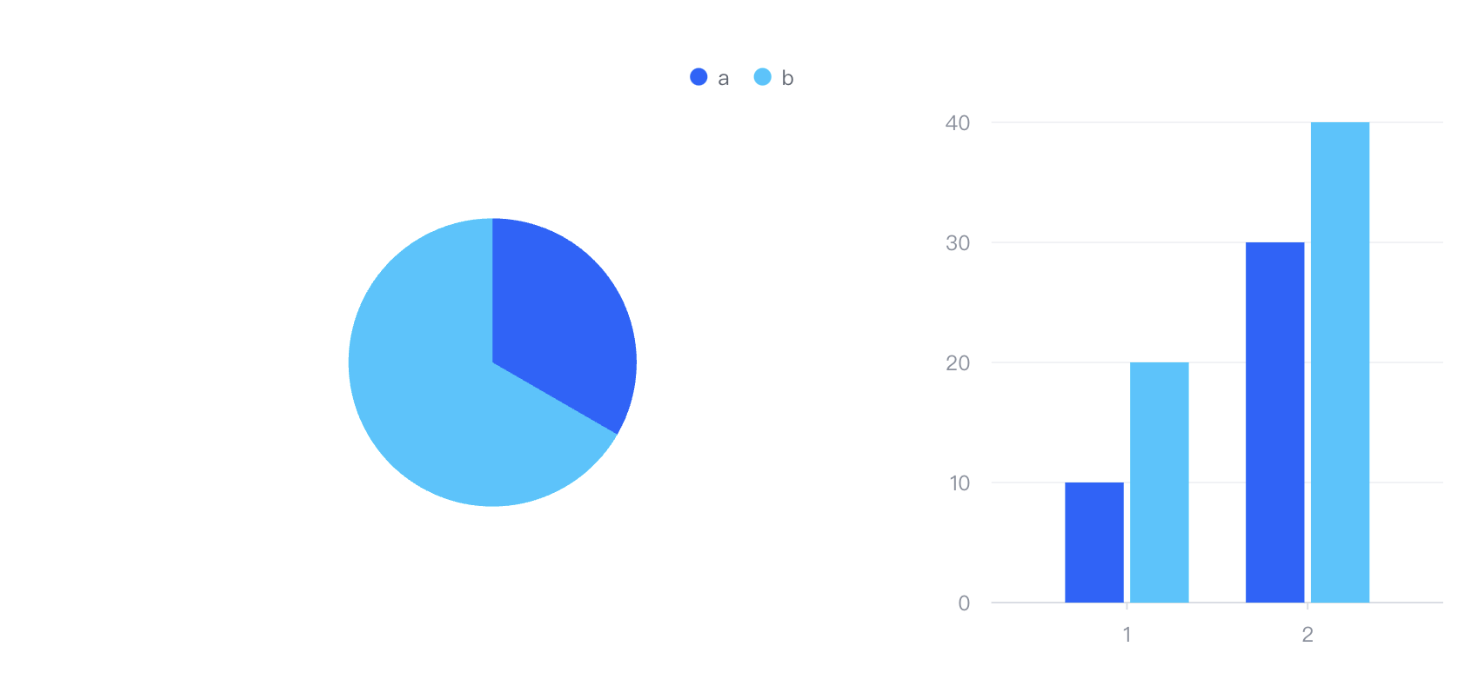
In this example, it is also a combined chart, but its two series appear in different regions. As mentioned above, we use layout to manage the layout of regions. In this example, we use the following code:
  layout: {
    type: 'grid',
    col: 4,
    row: 3,
    elements: [
      {
        modelId: 'legend',
        col: 0,
        colSpan: 4,
        row: 0
      },
      {
        modelId: 'pie-region',
        col: 0,
        colSpan: 2,
        row: 1
      },
      {
        modelId: 'axis-left',
        col: 2,
        row: 1
      },
      {
        modelId: 'bar-region',
        col: 3,
        row: 1
      },
      {
        modelId: 'axis-bottom',
        col: 3,
        row: 2
      }
    ]
  },
Above, the layout of regions and components was managed in a manner similar to a grid. We use these modelIds to associate the corresponding configurations of regions and components:
  region: [
    {
      id: 'pie-region'
    },
    {
      id: 'bar-region'
    }
  ],
  axes: [
    {
      id: 'axis-left',
      regionId: 'bar-region',
      orient: 'left'
    },
    {
      id: 'axis-bottom',
      regionId: 'bar-region',
      orient: 'bottom'
    }
] These three are the core components in the VisActor visualization system, and their relationship is hierarchical, from the bottom layer to the top layer as follows:
VRender is a low-level visualization rendering engine responsible for the most basic graphic drawing and rendering tasks:
-
It provides rich visualization rendering capabilities, including custom animations, element composition, and narrative arrangement
-
It is the foundation of the VisActor visualization system, providing rendering capabilities for upper-level libraries
-
VRender offers a plugin system for flexible extension
-
It can seamlessly switch between 2D/3D effects
-
It handles low-level Canvas operations, graphic drawing, scene management, etc.
VGrammar is a visualization grammar library based on VRender:
-
It uses declarative syntax to describe data visualization
-
VGrammar maps data to visual elements, handling data transformation, marks, scales, etc.
-
It provides more advanced APIs to simplify the process of creating complex visualizations
-
VGrammar is responsible for chart grammar definition, data mapping, automatic layout, etc.
-
It is essentially a further encapsulation of VRender, adding more visualization grammar concepts
VChart is the top-level chart component library:
-
It is built on VGrammar and encapsulates common chart types (bar charts, pie charts, line charts, etc.)
-
VChart provides ready-to-use chart components, so users do not need to understand the underlying graphic grammar
-
It features cross-platform capabilities, automatically adapting to desktop, H5, and various mini-program environments
-
VChart offers comprehensive data narrative capabilities, including extensive annotations, animations, flow control, and narrative templates
-
It is aimed at end users, providing the most user-friendly visualization interface and APIs
The architectural relationship among these three can be understood as:
VChart (图表组件库)
   ↓
VGrammar (可视化语法)
   ↓
VRender (渲染引擎)
   ↓
浏览器/Canvas/WebGL
From the code implementation perspective:
-
VChart uses VGrammar to define and construct charts
-
VGrammar uses VRender for actual drawing and rendering
-
Ultimately, VRender controls the underlying Canvas/WebGL to draw graphics
This layered architecture allows developers to choose tools at different levels according to their needs: if highly customized visualizations are required, VRender or VGrammar can be used directly; if quick creation of standard charts is needed, VChart can be used.
The overall architecture adopts a modular design, with the core divided into the following main parts:
-
Core Engine (Core): The central controller of VChart, responsible for organizing the collaboration of various modules
-
Chart: Specific implementations of various chart types
-
Series: Responsible for mapping data to graphics in charts
-
Mark: Basic graphic elements
-
Region: Defines the rendering area of the chart
-
Component: Additional components such as axes, legends, etc.
-
Layout: Handles the position calculation of chart elements
-
Event: Handles user interactions
-
Scale: Related to data mapping and scales
-
Data: Data transformation and processing
The VChart class is the entry point of the entire chart library, responsible for instantiating and managing the lifecycle of the entire chart.
// packages/vchart/src/core/vchart.ts
export class VChart implements IVChart {
  readonly id = createID();

  // 用于注册图表、组件、系列等
  static useRegisters(comps: (() => void)[]) { ... }
  static useChart(charts: IChartConstructor[]) { ... }
  static useSeries(series: ISeriesConstructor[]) { ... }

  // 核心渲染流程
  renderSync(morphConfig?: IMorphConfig) { ... }
  async renderAsync(morphConfig?: IMorphConfig) { ... }

  // 数据更新方法
  updateData(id: StringOrNumber, data: DataView | Datum[] | string, ...) { ... }
  updateSpec(spec: ISpec, forceMerge: boolean = false, ...) { ... }

  // 状态管理
  setSelected(datum: MaybeArray<any> | null, ...) { ... }
  setHovered(datum: MaybeArray<Datum> | null, ...) { ... }
}
The lifecycle of VChart mainly includes:
-
Initialization of configuration and data
-
Creation of chart instance
-
Layout calculation
-
Rendering
-
Interaction event handling
-
Updating and destruction
The chart module implements various types of charts, such as bar charts, line charts, pie charts, etc., all inheriting from BaseChart.
// packages/vchart/src/chart/base/base-chart.ts
export class BaseChart<T extends IChartSpec> extends CompilableBase implements IChart {
  readonly type: string = 'chart';
  readonly seriesType: string;

  protected _regions: IRegion[] = [];
  protected _series: ISeries[] = [];
  protected _components: IComponent[] = [];

  protected _layoutFunc: LayoutCallBack;
  protected _layoutRect: IRect = { ... };

  layout(params: ILayoutParams): void { ... }
  compile() { ... }
}
For example, BarChart inherits from BaseChart
export class BarChart<T extends IBarChartSpec = IBarChartSpec> extends BaseChart<T> {
  static readonly type: string = ChartTypeEnum.bar;
  static readonly seriesType: string = SeriesTypeEnum.bar;
  static readonly transformerConstructor = BarChartSpecTransformer;
  readonly transformerConstructor = BarChartSpecTransformer;
  readonly type: string = ChartTypeEnum.bar;
  readonly seriesType: string = SeriesTypeEnum.bar;
}
The chart module is responsible for:
-
Determining chart types and layouts
-
Managing included areas, series, and components
-
Handling the overall mapping from data to visual elements
The series module is the core mapping from data to visual representation, with different series types corresponding to different graphical forms.
// packages/vchart/src/series/base/base-series.ts
export abstract class BaseSeries<T extends ISeriesSpec> extends BaseModel<T> implements ISeries {
  readonly type: string = 'series';
  readonly coordinate: CoordinateType = 'none';

  protected _region: IRegion;
  protected _rootMark: IGroupMark = null;
  protected _seriesMark: Maybe<IMark> = null;

  protected _rawData!: DataView;
  protected _data: SeriesData = null;

  abstract initMark(): void;
  abstract initMarkStyle(): void;
  abstract dataToPosition(data: Datum, checkInViewData?: boolean): IPoint;
}
Series modules are responsible for:
-
Converting data to graphical marks
-
Handling data mapping for specific chart types
-
Managing the style and state of marks
Marks are the most basic visual elements, such as lines, rectangles, points, etc., which are the fundamental units that make up charts. Corresponding code implementations can be found in the packages/vchart/src/mark directory.
Marks are responsible for:
-
Implementing specific graphic rendering
-
Handling interaction states (such as highlight, selection)
-
Binding with data
Regions define the rendering positions of charts on the canvas and can contain multiple series. Corresponding code is in packages/vchart/src/region
The region module is responsible for:
-
Determining the position and size of each sub-region in the chart
-
Managing the series contained within
-
Handling layout relationships between regions
Components are auxiliary elements in charts besides data graphics, such as axes, legends, titles, etc. Various component implementations are in the packages/vchart/src/component directory
The component module is responsible for:
-
Rendering various auxiliary elements
-
Interacting with users (such as legend clicks)
-
Collaborating with the main chart
The layout module is responsible for calculating the position and size of each chart element. Corresponding code is in packages/vchart/src/layout. Specifically, it includes:
-
Calculating element positions
-
Adjusting container size adaptively
-
Handling layering relationships between elements
The event module handles user interactions and internal events. Specifically, it includes:
-
Handling user interaction events (such as clicks, hover)
-
Dispatching internal events
-
Triggering data updates and rendering updates
The scale module is responsible for mapping data to visual attributes. Specifically, it includes:
-
Handling the mapping between data and visual space
-
Managing various scales (linear, discrete, color, etc.)
-
Calculating axis ranges and ticks
The data module handles the transformation and processing of raw data. Specifically, it includes:
-
Parsing and transforming data
-
Statistical calculations
-
Handling missing and abnormal values
The rendering process of VChart mainly includes the following steps:
-
Initialization: Create a VChart instance through the spec configuration
-
Compilation: Parse the configuration and create various components and series
-
Layout: Calculate the position and size of each element
-
Data processing: Process and transform data
-
Rendering preparation: Bind data to marks
-
Actual rendering: Draw marks onto the canvas
-
Interaction binding: Bind various interaction events
When data or configuration changes:
-
Call updateData or updateSpec methods
-
Reprocess affected data
-
Update related scales
-
Re-layout (if needed)
-
Update affected marks
-
Trigger re-rendering