The following is a machine learning model to detect and predict the occurrence of fraudulent transactions on the basis of the following factors:
- Step (a unit of time in the real world, in this case 1 step is 1 hour of time)
- Type of transaction
- Amount of transaction
- Name of originator of transaction
- Initial balance of originator
- Final balance of originator
- Initial balance of recipient
- Final balance of recipient
- Name of recipient
- isFraud (This is the transactions made by the fraudulent agents inside the simulation. In this specific dataset the fraudulent behavior of the agents aims to profit by taking control or customers accounts and try to empty the funds by transferring to another account and then cashing out of the system.)
- isFlaggedFraud (The business model aims to control massive transfers from one account to another and flags illegal attempts. An illegal attempt in this dataset is an attempt to transfer more than 200.000 in a single transaction.)
The dataset can be found here.

Data cleaning involves checking for NULL values, removing missing columns with missing values, etc.
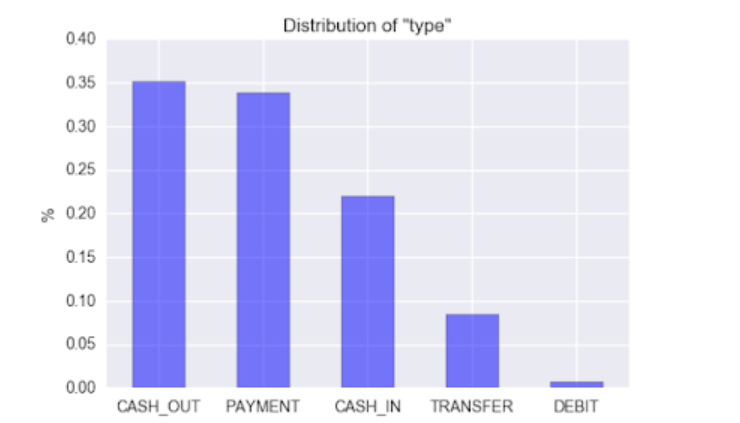
Distribution on the basis of type of transactions is as follows. CASH_OUT and TRANSFER are the top two types with ~35%.
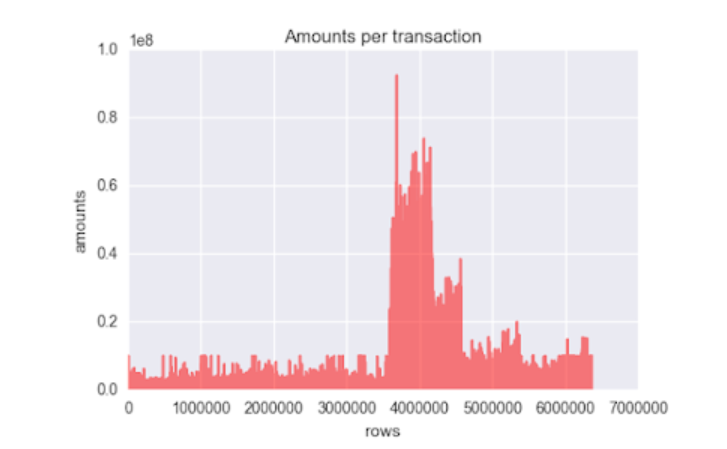
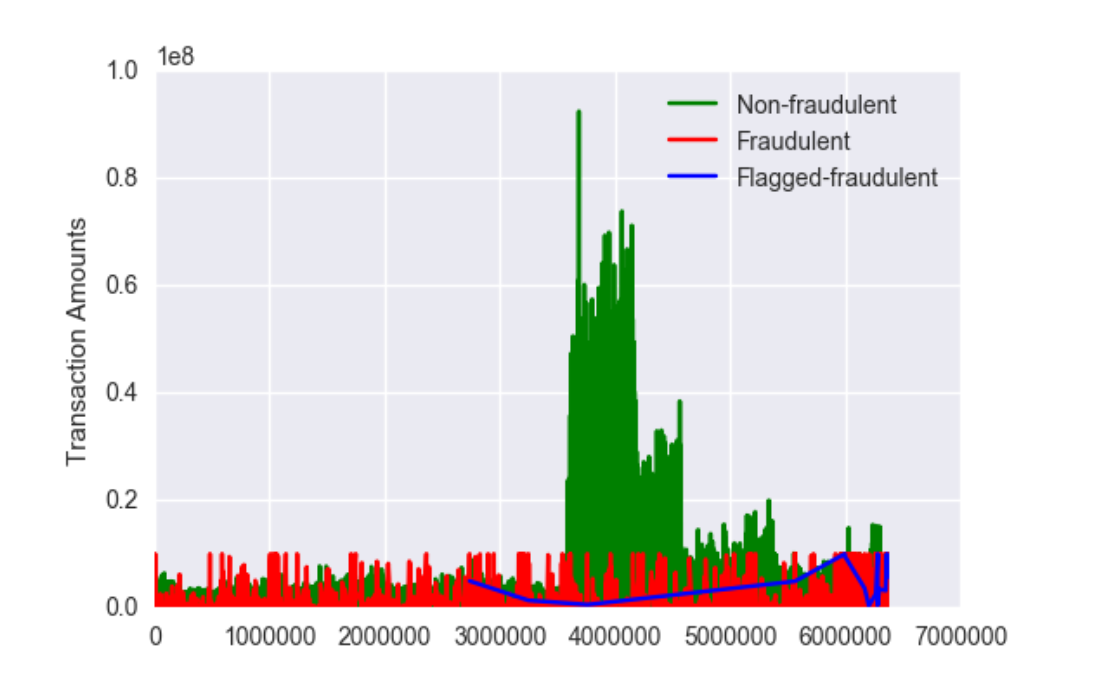
75% of the data falls under amount 208722, but the maximum amount being 92445517 which is pretty large, as also can be seen in the graph.
There are a lot of extreme outliers present in this data.
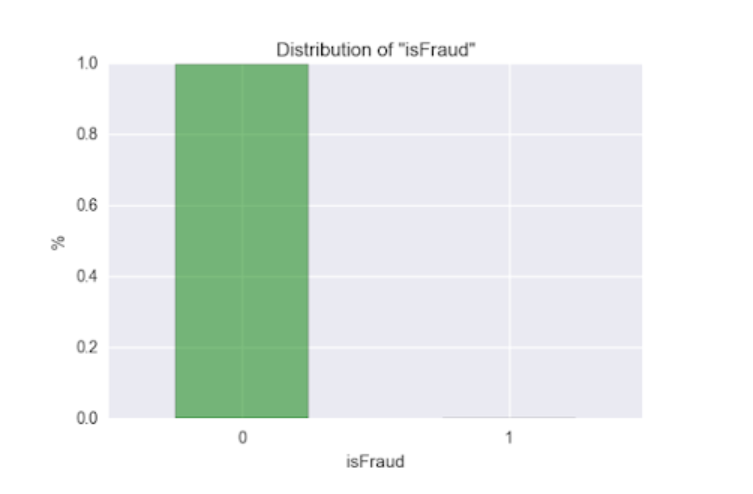
This is a highly skewed data, only 0.1% of the transactions are fraudulent.
As we can see, amounts in fraudulent transactions varies from 0 to 107, with an mean of around 14,67,968. But the current model only flagged transactions having very high amounts, with a minimum amount of 3,53,874.
Since, only types CASH_OUT and TRANSFER have frauds, so the following plots consists of transactions and frauds from these 2 types only. As we can see, number of CASH_OUT and TRANSFER transactions varies a lot in the whole month, i.e. low in the first week, high in middle and again fairly low towards the end.
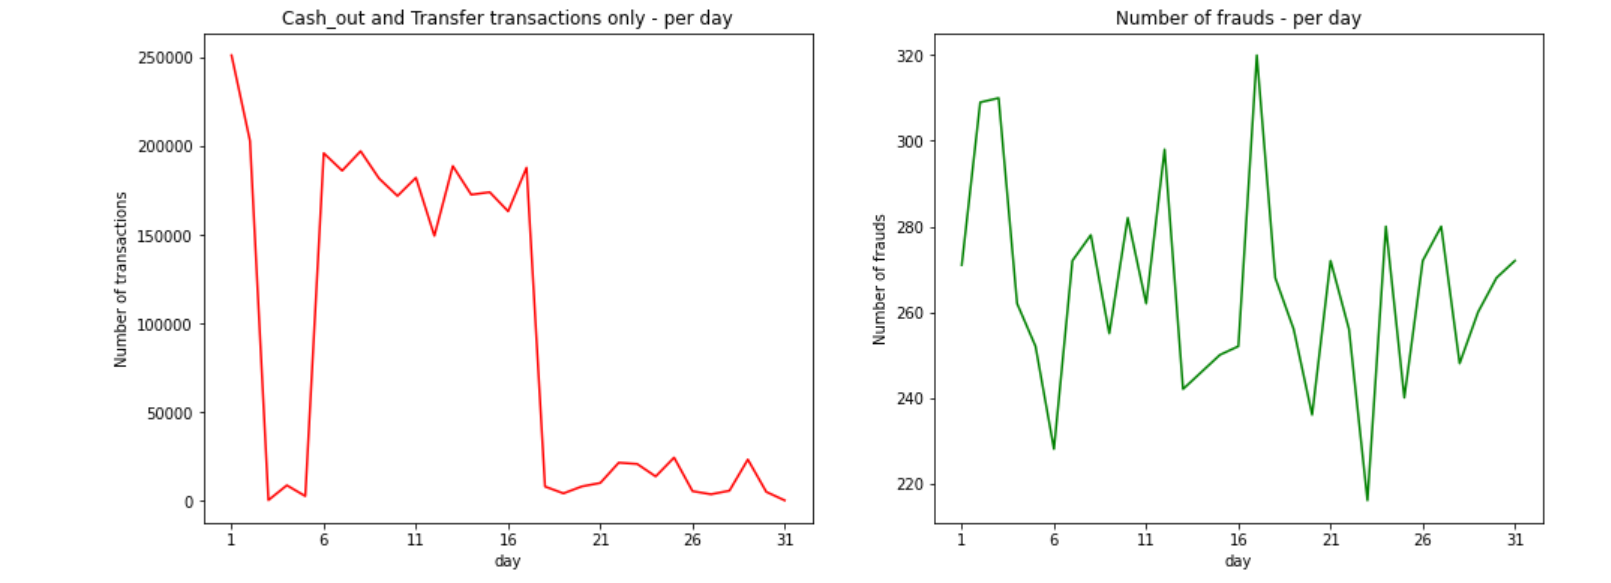
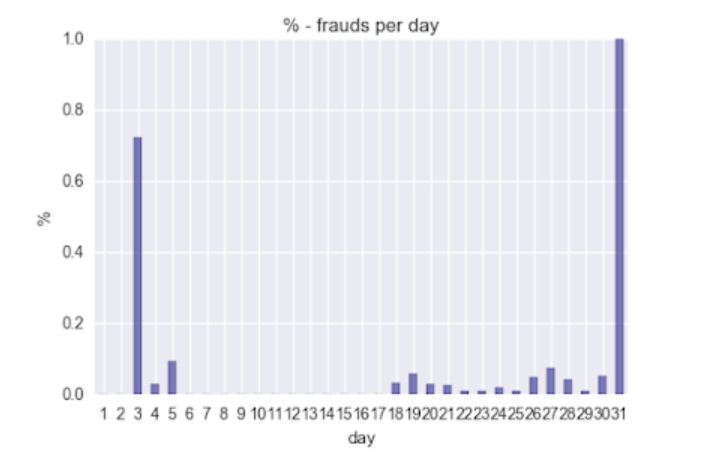
So, on an average 7.4% of the transactions are fraudulent per day, which is little high due to the presence of high frauds percentage on days 3rd and 31st. These 2 days are clear outliers for this month.
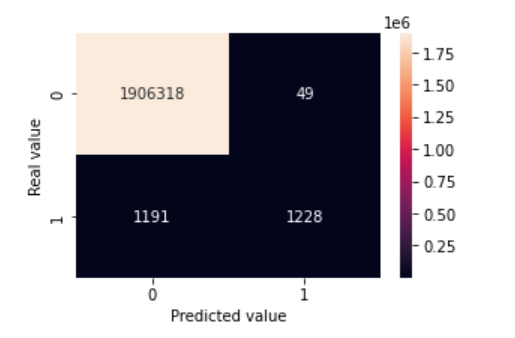
The models used are Logistic Regression and Random Forest.
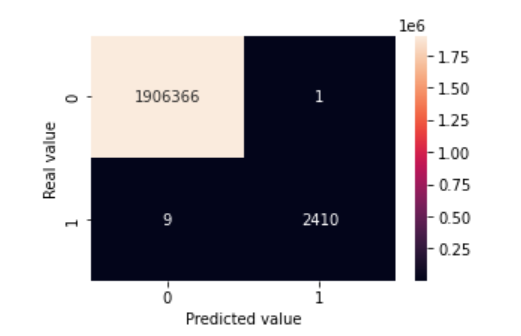
Logistic regression is a process of modeling the probability of a discrete outcome given an input variable. The confusion matrix is plotted as below
Random Forest Regression is a supervised learning algorithm that uses ensemble learning method for regression. Ensemble learning method is a technique that combines predictions from multiple machine learning algorithms to make a more accurate prediction than a single model. The confusion matrix is plotted as below