A live oscilloscope for serial data, in your terminal.


Your board is printing numbers. You want to see them move. Right now that means opening the Arduino IDE's plotter (a GUI, Windows-shaped, one window), or piping to a file and loading it into Python after the fact — neither of which helps while you are actually turning a PID knob.
termscope plots the stream as it arrives, in the terminal you already have open, over SSH if that is where the board is.
$ pipx run termscope --demo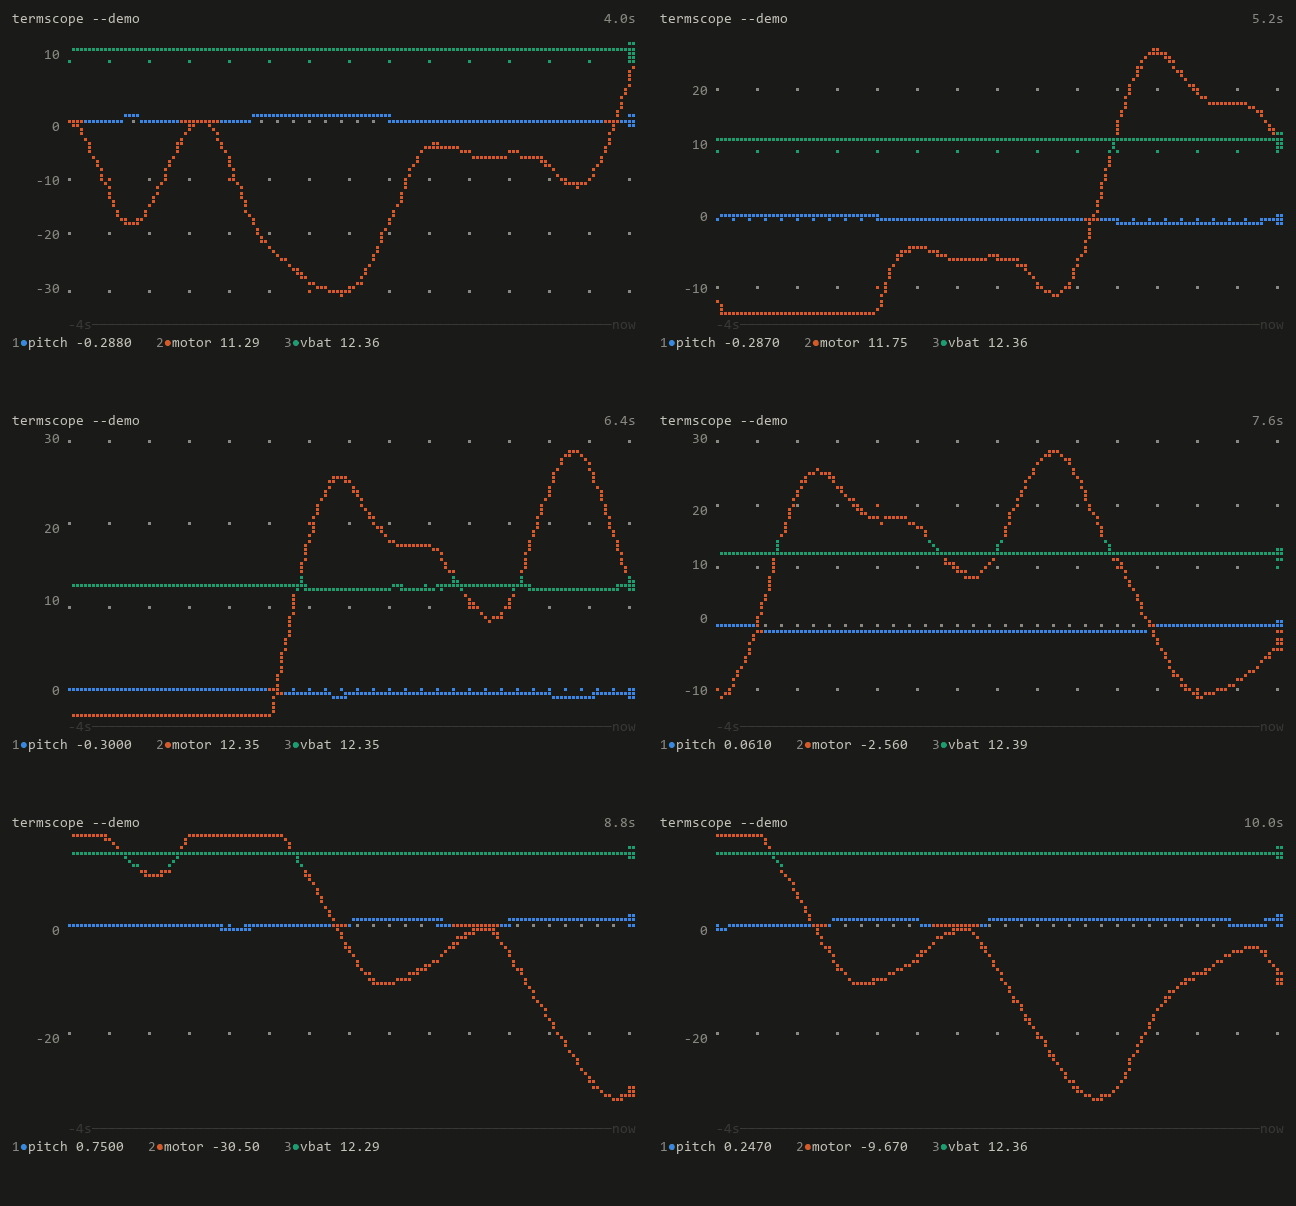
No hardware needed for that — --demo simulates a two-wheel balancing robot.
Here is the same thing as text, which is what the tool actually writes to your
terminal:
balancing-robot.csv (replay)                                          snapshot
       ⠀⠀⠀⠀⠀⠀⠀⠀⠀⠀⠀⠀⠀⠀⠀⠀⠀⠀⡏⠉⠉⠉⠉⠉⠉⠉⠉⢣⠀⠀⠀⢀⠏⠉⠉⠉⠉⠉⢣⠀⠀⠀⠀⠀⠀⠀⠀⠀⠀⠀⠀⠀⠀⠀⠀⠀⠀⠀⠀⠀⠀⠀⠀⠀⠀⠀⠀⠀⠀⠀⠀
       ⠒⠒⠒⠒⠒⠒⠒⠒⠒⠒⠒⠒⠒⠒⠒⠒⠒⢲⠓⠒⠒⠒⠒⠒⠒⠒⠒⠚⢶⠒⠒⡺⠒⠒⠒⠒⠒⠒⠚⡖⠒⠒⠒⠒⠒⠒⠒⠒⠒⠒⠒⠒⠒⠒⠒⠒⠒⠒⠒⠒⠒⠒⠒⠒⠒⠒⠒⠒⠒⠒⠿
    10 ⠁⠀⠀⠀⠀⠁⠀⠀⠀⠀⠁⠀⠀⠀⠀⠁⠀⢸⠀⠀⠁⠀⠀⠀⠀⠁⠀⠀⠀⠳⠵⠃⠀⠀⠀⠁⠀⠀⠀⢱⠁⠀⠀⠀⠀⠁⠀⠀⠀⠀⠁⠀⠀⠀⠀⠁⠀⠀⠀⠀⠁⠀⠀⠀⠀⠁⠀⠀⠀⠀⠁
       ⠀⠀⠀⠀⠀⠀⠀⠀⠀⠀⠀⠀⠀⠀⠀⠀⠀⡇⠀⠀⠀⠀⠀⠀⠀⠀⠀⠀⠀⠀⠀⠀⠀⠀⠀⠀⠀⠀⠀⠀⢇⠀⠀⠀⠀⠀⠀⠀⠀⠀⠀⠀⠀⠀⠀⠀⠀⠀⠀⠀⠀⠀⠀⠀⠀⠀⠀⠀⠀⠀⠀
       ⠀⠀⠀⠀⠀⠀⠀⠀⠀⠀⠀⠀⠀⠀⠀⠀⢠⠃⠀⠀⠀⠀⠀⠀⠀⠀⠀⠀⠀⠀⠀⠀⠀⠀⠀⠀⠀⠀⠀⠀⠸⡀⠀⠀⠀⠀⠀⠀⠀⠀⠀⠀⠀⠀⠀⠀⠀⠀⠀⠀⠀⠀⠀⠀⠀⠀⠀⠀⠀⠀⠀
     0 ⠖⠒⠦⠤⠤⠤⠤⠤⠤⠤⠤⠤⠤⠤⠤⠤⢼⢤⣄⣀⣄⣀⣄⣀⣄⣀⣄⣀⣄⡤⠤⣀⣄⣀⣄⣀⣄⣀⣄⡠⠤⢧⠤⠤⠤⠤⠤⠤⠤⠤⠤⠤⠤⠤⠤⠖⠖⠒⠖⠒⠖⠒⠦⠤⠤⠤⠤⠤⠤⠤⣶
       ⠀⠀⠀⠀⠀⠀⠀⠀⠀⠀⠀⠀⠀⠀⠀⠀⡎⠀⠀⠀⠀⠀⠀⠀⠀⠀⠀⠀⠀⠀⠀⠀⠀⠀⠀⠀⠀⠀⠀⠀⠀⠸⡀⠀⠀⠀⠀⠀⠀⡴⠉⢱⠀⠀⠀⠀⠀⠀⠀⠀⠀⠀⠀⠀⠀⠀⠀⠀⠀⠀⠀
       ⠀⠀⠀⠀⡴⠉⠓⢤⣀⣠⢤⣀⡀⠀⠀⢠⠃⠀⠀⠀⠀⠀⠀⠀⠀⠀⠀⠀⠀⠀⠀⠀⠀⠀⠀⠀⠀⠀⠀⠀⠀⠀⢣⠀⠀⠀⠀⠀⡜⠀⠀⠀⢣⠀⠀⠀⠀⠀⠀⠀⠀⠀⠀⠀⠀⠀⠀⡴⠚⠱⡀
       ⠀⠀⠀⢠⠃⠀⠀⠀⠀⠀⠀⠀⠳⡀⠀⡜⠀⠀⠀⠀⠀⠀⠀⠀⠀⠀⠀⠀⠀⠀⠀⠀⠀⠀⠀⠀⠀⠀⠀⠀⠀⠀⠈⣆⠀⠀⣠⠎⠀⠀⠀⠀⠘⡄⠀⠀⠀⠀⠀⠀⠀⠀⠀⠀⠀⣠⠞⠀⠀⠀⣣
   -10 ⠁⠀⠀⡜⠀⠁⠀⠀⠀⠀⠁⠀⠀⠳⠴⠁⠀⠀⠀⠀⠁⠀⠀⠀⠀⠁⠀⠀⠀⠀⠁⠀⠀⠀⠀⠁⠀⠀⠀⠀⠁⠀⠀⠈⠶⠋⠁⠀⠀⠀⠁⠀⠀⢣⠀⠁⠀⠀⠀⠀⠁⠀⠀⢀⠜⠁⠀⠀⠀⠀⠛
       ⠀⠀⠀⡇⠀⠀⠀⠀⠀⠀⠀⠀⠀⠀⠀⠀⠀⠀⠀⠀⠀⠀⠀⠀⠀⠀⠀⠀⠀⠀⠀⠀⠀⠀⠀⠀⠀⠀⠀⠀⠀⠀⠀⠀⠀⠀⠀⠀⠀⠀⠀⠀⠀⠈⡆⠀⠀⠀⠀⠀⠀⠀⠀⡎⠀⠀⠀⠀⠀⠀⠀
       ⠀⠀⢸⠀⠀⠀⠀⠀⠀⠀⠀⠀⠀⠀⠀⠀⠀⠀⠀⠀⠀⠀⠀⠀⠀⠀⠀⠀⠀⠀⠀⠀⠀⠀⠀⠀⠀⠀⠀⠀⠀⠀⠀⠀⠀⠀⠀⠀⠀⠀⠀⠀⠀⠀⠸⡄⠀⠀⠀⠀⠀⠀⡸⠀⠀⠀⠀⠀⠀⠀⠀
   -20 ⠄⠀⡇⠀⠀⠄⠀⠀⠀⠀⠄⠀⠀⠀⠀⠄⠀⠀⠀⠀⠄⠀⠀⠀⠀⠄⠀⠀⠀⠀⠄⠀⠀⠀⠀⠄⠀⠀⠀⠀⠄⠀⠀⠀⠀⠄⠀⠀⠀⠀⠄⠀⠀⠀⠀⢧⠀⠀⠀⠀⠄⠀⡇⠀⠀⠄⠀⠀⠀⠀⠄
       ⠀⢰⠁⠀⠀⠀⠀⠀⠀⠀⠀⠀⠀⠀⠀⠀⠀⠀⠀⠀⠀⠀⠀⠀⠀⠀⠀⠀⠀⠀⠀⠀⠀⠀⠀⠀⠀⠀⠀⠀⠀⠀⠀⠀⠀⠀⠀⠀⠀⠀⠀⠀⠀⠀⠀⠈⡆⠀⠀⠀⠀⢸⠀⠀⠀⠀⠀⠀⠀⠀⠀
       ⢀⠇⠀⠀⠀⠀⠀⠀⠀⠀⠀⠀⠀⠀⠀⠀⠀⠀⠀⠀⠀⠀⠀⠀⠀⠀⠀⠀⠀⠀⠀⠀⠀⠀⠀⠀⠀⠀⠀⠀⠀⠀⠀⠀⠀⠀⠀⠀⠀⠀⠀⠀⠀⠀⠀⠀⠱⡀⠀⠀⠀⡇⠀⠀⠀⠀⠀⠀⠀⠀⠀
       ⡼⠀⠀⠀⠀⠀⠀⠀⠀⠀⠀⠀⠀⠀⠀⠀⠀⠀⠀⠀⠀⠀⠀⠀⠀⠀⠀⠀⠀⠀⠀⠀⠀⠀⠀⠀⠀⠀⠀⠀⠀⠀⠀⠀⠀⠀⠀⠀⠀⠀⠀⠀⠀⠀⠀⠀⠀⢣⠀⠀⣰⠁⠀⠀⠀⠀⠀⠀⠀⠀⠀
   -30 ⠁⠀⠀⠀⠀⠁⠀⠀⠀⠀⠁⠀⠀⠀⠀⠁⠀⠀⠀⠀⠁⠀⠀⠀⠀⠁⠀⠀⠀⠀⠁⠀⠀⠀⠀⠁⠀⠀⠀⠀⠁⠀⠀⠀⠀⠁⠀⠀⠀⠀⠁⠀⠀⠀⠀⠁⠀⠈⠳⠤⠃⠀⠀⠀⠀⠁⠀⠀⠀⠀⠁
       ⠀⠀⠀⠀⠀⠀⠀⠀⠀⠀⠀⠀⠀⠀⠀⠀⠀⠀⠀⠀⠀⠀⠀⠀⠀⠀⠀⠀⠀⠀⠀⠀⠀⠀⠀⠀⠀⠀⠀⠀⠀⠀⠀⠀⠀⠀⠀⠀⠀⠀⠀⠀⠀⠀⠀⠀⠀⠀⠀⠀⠀⠀⠀⠀⠀⠀⠀⠀⠀⠀⠀
       -8s─────────────────────────────────────────────────────────────────now
1●pitch 0.2470   2●motor -9.670   3●vbat 12.36
Point it at a real board when you have one:
$ termscope /dev/ttyUSB0 --baud 115200Uploading firmware, pressing reset, or briefly losing a USB cable can make the operating system close the serial handle. Retry the same port instead of ending the scope:
$ termscope /dev/ttyUSB0 --baud 115200 --reconnect
$ termscope COM7 --reconnect 0.25       # retry every 250 ms
The header says reconnecting while the port is unavailable and returns to the
normal port label after it opens again. Existing plot history stays on screen,
but an unterminated line from the old connection is discarded so it cannot be
joined to the first line from the new device session.
Retrying is deliberately opt-in. Without --reconnect, open and read errors
still exit non-zero, which keeps scripts fail-fast. With it enabled, termscope
waits until you quit and retries only the originally selected operating-system
path; it does not scan for and silently switch to another serial device. On
Linux, a /dev/serial/by-id/... path is the safest way to follow one physical
adapter if /dev/ttyUSB0 may be renumbered. A path is not device
authentication, so do not enable automatic reconnect where another local user
can replace the device behind that path. Restart termscope if a firmware upload
also changes the telemetry format.
Live producers and a terminal renderer do not always run at the same speed.
TermScope holds at most 4,096 complete input lines between them. If a serial
device outruns the parser and renderer, the oldest queued lines are discarded
so the display catches up to the newest live data instead of accumulating an
unbounded delay. The header and status line show DROP N, and the exit summary
reports the same count.
Files and stdin use backpressure instead: their producer waits for queue space,
so replay and ordinary pipelines do not lose lines at this boundary. Live CSV
or raw recording cannot recover a line already dropped before parsing, so any
non-zero DROP count means the recording is incomplete. A zero count covers
only TermScope's own handoff queue; it does not prove that the board, USB/UART
adapter, operating-system driver, or pyserial delivered every byte.
$ pip install termscope[serial]The [serial] extra pulls in pyserial, which is only needed to open a physical
port. The core has no dependencies at all — plotting, parsing and the
terminal layer are pure standard library, so --demo, pipes and log replay work
on a bare interpreter.
Python 3.9+. Linux, macOS, Windows.
There is no single standard for serial telemetry, so termscope detects the format instead of asking you to adopt one. All five of these work with no flags:
Your printf |
Channels you get |
|---|---|
pitch:1.23 roll:-4.5 |
pitch, roll |
1.23, -4.5, 0.02 |
ch0, ch1, ch2 (Arduino Serial Plotter style) |
{"pitch": 1.23} |
pitch |
time,pitch,roll then 0.1,1.23,-4.5 |
time, pitch, roll (CSV header names the columns) |
>temp:1000:23.5§°C |
temp, plotted at the protocol's 1000 ms timestamp (Teleplot time series) |
Real streams are messier than any of those, so the parser is built for the mess:
- Debug output mixed into telemetry is ignored, not fatal. A stray
printf("boot ok\n")between readings does not break the plot. - A format is locked in once detected, so one malformed line in a thousand cannot silently re-key your channels.
- ANSI colour and control bytes are stripped, so a log line wrapped in escape codes still parses.
- NaN and inf are dropped rather than being allowed to collapse the y-axis.
--prefix '>'if you want only lines your firmware tags as data.
Firmware that already prints Teleplot-compatible serial messages does not need a second output format for termscope. Single values, explicit millisecond timestamps, units, and timestamped batches are accepted automatically:
>temperature:23.5
>temperature:1627551892437:23.5§°C
>temperature:1627551892437:23.5;1627551892537:23.7§°C
Explicit timestamps become the x-axis, so buffered batches retain their real spacing instead of arriving as one artificial vertical stack. Units are accepted but the current terminal legend keeps the protocol's stable series name rather than displaying unit metadata.
This is deliberately the time-series subset, not a claim of full Teleplot
compatibility. XY (|xy), text (|t), no-plot (|np), clear-history
(|clr), log, and 3D messages remain visible in raw view but are not drawn as
ordinary time-series values. Silently turning those shapes into a line chart
would be worse than declining to plot them.
Shared axis (default) — every channel on one scale, so relative magnitudes are honest.
Split (--split, or m while running) — one panel per channel, each
independently scaled. This is what you want when a battery in volts shares a
screen with a motor command in percent:
balancing-robot.csv (replay)                                          snapshot
pitch  ⠀⠀⠀⠀⠀⠀⠀⠀⠀⠀⠀⠀⠀⠀⠀⠀⠀⠀⠀⠀⠀⠀⠀⠀⠀⠀⠀⠀⠀⠀⠀⠀⠀⠀⠀⠀⠀⠀⠀⠀⠀⠀⠀⠀⠀⠀⠀⠀⠀⠀⠀⠀⠀⠀⠀⠀⠀⢀⡤⠤⡄⠀⠀⠀⠀⠀⠀⠀⠀⠀⠀
       ⠹⡄⠀⠀⠀⠀⠀⠀⠀⠀⠀⠀⠀⠀⠀⠀⠀⠀⠀⠀⠀⠀⠀⠀⠀⠀⠀⠀⠀⠀⠀⠀⠀⠀⠀⠀⠀⠀⠀⠀⠀⠀⠀⠀⠀⠀⠀⠀⠀⠀⠀⠀⠀⠀⠀⠀⣠⠊⠀⠀⠘⡄⠀⠀⠀⠀⠀⠀⠀⠀⠀
   0.5 ⠄⠙⡄⠀⠀⠄⠀⠀⠀⠀⠄⠀⠀⠀⠀⠄⠀⠀⠀⠀⠄⠀⠀⠀⠀⠄⠀⠀⠀⠀⠄⠀⠀⠀⠀⠄⠀⠀⠀⠀⠄⠀⠀⠀⠀⠄⠀⠀⠀⠀⠄⠀⠀⠀⠀⡴⠃⠀⠀⠀⠄⠹⡄⠀⠀⠄⠀⠀⠀⠀⠄
       ⠀⠀⠱⡀⠀⠀⠀⠀⠀⠀⠀⠀⠀⠀⠀⠀⠀⠀⠀⠀⠀⠀⠀⠀⠀⠀⠀⠀⠀⠀⠀⠀⠀⠀⠀⠀⠀⠀⠀⠀⠀⠀⠀⠀⠀⠀⠀⠀⠀⠀⠀⠀⠀⠀⡴⠁⠀⠀⠀⠀⠀⠀⠱⡄⠀⠀⠀⠀⠀⠀⠀
       ⠀⠀⠀⢣⠀⠀⠀⠀⠀⠀⠀⠀⢀⡴⠲⡄⠀⠀⠀⠀⠀⠀⠀⠀⠀⠀⠀⠀⠀⠀⠀⠀⠀⠀⠀⠀⠀⠀⠀⠀⠀⠀⠀⣠⠶⢤⣀⠀⠀⠀⠀⠀⠀⡜⠁⠀⠀⠀⠀⠀⠀⠀⠀⠙⠦⣀⡀⠀⠀⠀⣶
       ⠀⠀⠀⠀⠧⣄⡤⠖⠒⠒⠒⠒⠋⠀⠀⠹⡀⠀⠀⠀⠀⠀⠀⠀⠀⠀⠀⠀⠀⠀⠀⠀⠀⠀⠀⠀⠀⠀⠀⠀⠀⠀⡼⠁⠀⠀⠈⠙⢦⡀⠀⢀⡜⠀⠀⠀⠀⠀⠀⠀⠀⠀⠀⠀⠀⠀⠙⠢⢤⡴⠃
   0.0 ⠄⠀⠄⠀⠄⠀⠄⠀⠄⠀⠄⠀⠄⠀⠄⠀⢵⣀⣄⣀⣄⣀⣄⣀⣄⣀⣄⣀⣄⣀⣄⣀⣄⣀⣄⣀⣄⣀⣄⣀⣄⡜⠄⠀⠄⠀⠄⠀⠄⠉⠖⠊⠄⠀⠄⠀⠄⠀⠄⠀⠄⠀⠄⠀⠄⠀⠄⠀⠄⠀⠄
motor  ⠂⠀⠂⠀⠂⠀⠂⠀⠂⠀⠂⠀⠂⠀⠂⠀⡺⠉⠋⠉⠋⠉⠋⠉⠋⠉⠋⠉⠋⠉⠋⠉⠋⠉⠋⠉⠋⠉⠋⠉⠋⢳⠂⠀⠂⠀⠂⠀⠂⣀⠦⢄⠂⠀⠂⠀⠂⠀⠂⠀⠂⠀⠂⠀⠂⠀⠂⠀⠂⠀⠂
       ⠀⠀⠀⠀⡔⠋⠒⠦⠤⠤⠤⠤⣄⠀⠀⢰⠃⠀⠀⠀⠀⠀⠀⠀⠀⠀⠀⠀⠀⠀⠀⠀⠀⠀⠀⠀⠀⠀⠀⠀⠀⠀⢳⡀⠀⠀⠀⣠⠞⠁⠀⠈⢣⠀⠀⠀⠀⠀⠀⠀⠀⠀⠀⠀⠀⠀⣠⠔⠚⠳⣄
       ⠀⠀⠀⡜⠀⠀⠀⠀⠀⠀⠀⠀⠈⠳⠴⠃⠀⠀⠀⠀⠀⠀⠀⠀⠀⠀⠀⠀⠀⠀⠀⠀⠀⠀⠀⠀⠀⠀⠀⠀⠀⠀⠀⠙⠶⠒⠉⠀⠀⠀⠀⠀⠀⢣⡀⠀⠀⠀⠀⠀⠀⠀⠀⣠⠔⠉⠁⠀⠀⠀⠛
       ⠀⠀⡰⠁⠀⠀⠀⠀⠀⠀⠀⠀⠀⠀⠀⠀⠀⠀⠀⠀⠀⠀⠀⠀⠀⠀⠀⠀⠀⠀⠀⠀⠀⠀⠀⠀⠀⠀⠀⠀⠀⠀⠀⠀⠀⠀⠀⠀⠀⠀⠀⠀⠀⠀⠳⡄⠀⠀⠀⠀⠀⠀⡰⠃⠀⠀⠀⠀⠀⠀⠀
   -20 ⠁⢠⠃⠀⠀⠁⠀⠀⠀⠀⠁⠀⠀⠀⠀⠁⠀⠀⠀⠀⠁⠀⠀⠀⠀⠁⠀⠀⠀⠀⠁⠀⠀⠀⠀⠁⠀⠀⠀⠀⠁⠀⠀⠀⠀⠁⠀⠀⠀⠀⠁⠀⠀⠀⠀⠙⡄⠀⠀⠀⠁⣰⠃⠀⠀⠁⠀⠀⠀⠀⠁
       ⣰⠃⠀⠀⠀⠀⠀⠀⠀⠀⠀⠀⠀⠀⠀⠀⠀⠀⠀⠀⠀⠀⠀⠀⠀⠀⠀⠀⠀⠀⠀⠀⠀⠀⠀⠀⠀⠀⠀⠀⠀⠀⠀⠀⠀⠀⠀⠀⠀⠀⠀⠀⠀⠀⠀⠀⠘⢆⠀⠀⢠⠇⠀⠀⠀⠀⠀⠀⠀⠀⠀
       ⠀⠀⠀⠀⠀⠀⠀⠀⠀⠀⠀⠀⠀⠀⠀⠀⠀⠀⠀⠀⠀⠀⠀⠀⠀⠀⠀⠀⠀⠀⠀⠀⠀⠀⠀⠀⠀⠀⠀⠀⠀⠀⠀⠀⠀⠀⠀⠀⠀⠀⠀⠀⠀⠀⠀⠀⠀⠈⠑⠒⠃⠀⠀⠀⠀⠀⠀⠀⠀⠀⠀
vbat   ⠂⠀⠀⠀⠀⣂⢀⠀⠀⠀⠂⠀⠀⠀⠀⠂⡰⡀⠀⠀⠂⠀⠀⠀⠀⠂⠀⠀⠀⠀⠂⠀⠀⠀⠀⠂⠀⠀⠀⠀⢂⣤⡀⠀⠀⠂⠀⠀⢀⣠⡦⣄⠀⠀⠀⠂⠀⠀⠀⠀⠂⠀⠀⠀⠀⠂⠀⠀⠀⠀⠂
       ⠀⠀⠀⢀⠞⠉⠙⠛⠗⠚⠚⠷⠦⣆⠀⡸⠁⢇⠀⠀⠀⠀⠀⠀⠀⠀⠀⠀⠀⣀⣤⡀⠀⠀⠀⠀⠀⠀⠀⣠⠞⠀⠱⣄⣀⢀⣤⡴⠋⠃⠀⠈⢳⡀⠀⠀⠀⠀⠀⠀⠀⠀⠀⠀⢀⣀⣴⠾⠟⠹⣄
       ⠀⠀⢀⠎⠀⠀⠀⠀⠀⠀⠀⠀⠀⠈⠙⠁⠀⠈⡆⠀⠀⠀⠀⠀⣀⠀⣠⡴⠋⠁⠉⠸⣄⠀⠀⠀⠀⠀⡴⠋⠀⠀⠀⠉⠙⠋⠉⠀⠀⠀⠀⠀⠈⠑⣆⠀⠀⠀⠀⠀⠀⠀⢀⡜⠉⠉⠁⠀⠀⠀⠛
       ⠀⢠⠏⠀⠀⠀⠀⠀⠀⠀⠀⠀⠀⠀⠀⠀⠀⠀⠻⣄⠀⣠⡴⠟⠙⠋⠁⠁⠀⠀⠀⠀⠸⣆⠀⠀⠀⡼⠃⠀⠀⠀⠀⠀⠀⠀⠀⠀⠀⠀⠀⠀⠀⠀⠈⢧⡀⠀⠀⠀⠀⢠⠏⠀⠀⠀⠀⠀⠀⠀⠀
 12.30 ⢴⠋⠀⠀⠀⠄⠀⠀⠀⠀⠄⠀⠀⠀⠀⠄⠀⠀⠀⠘⠶⠉⠀⠀⠀⠄⠀⠀⠀⠀⠄⠀⠀⠘⣦⣴⡼⠀⠀⠀⠄⠀⠀⠀⠀⠄⠀⠀⠀⠀⠄⠀⠀⠀⠀⠄⢻⣄⡀⠀⢤⠎⠀⠀⠀⠄⠀⠀⠀⠀⠄
       ⠀⠀⠀⠀⠀⠀⠀⠀⠀⠀⠀⠀⠀⠀⠀⠀⠀⠀⠀⠀⠀⠀⠀⠀⠀⠀⠀⠀⠀⠀⠀⠀⠀⠀⠀⠈⠀⠀⠀⠀⠀⠀⠀⠀⠀⠀⠀⠀⠀⠀⠀⠀⠀⠀⠀⠀⠀⠈⠛⠛⠋⠀⠀⠀⠀⠀⠀⠀⠀⠀⠀
       -8s─────────────────────────────────────────────────────────────────now
1●pitch 0.2470   2●motor -9.670   3●vbat 12.36
There is deliberately no third mode that puts two different y-scales on one plot. The alignment between two such scales is arbitrary, so a dual-axis chart invents correlations that are not in the data.
space |
hold / resume | a |
autoscale on / off |
1–8 |
toggle one channel | 0 |
show every channel |
m |
shared / split axes | t |
x-axis: time / samples |
[ ] |
shorter / longer window | + - |
zoom y (autoscale off) |
g |
gridlines | v |
raw text view |
r |
start / stop recording | c |
clear buffers |
? |
help | q |
quit |
Plot and log at the same time, then replay the capture later:
$ termscope /dev/ttyUSB0 --record run.csv
$ termscope --replay run.csv
The CSV is one row per sample with a column per channel. A channel that appears
partway through a capture gets its own column, and rows that predate it are left
empty rather than back-filled with zeros — the file never claims a reading that
did not arrive. --record-raw logs the unparsed stream instead, for when the
interesting part is the line the parser could not read.
Replay reconstructs the original timing. If the stream carries its own clock, termscope plots against that instead of against arrival time — so a replay looks like the capture, not like however fast the file happened to be read. Recorded captures always carry one, and common firmware names are detected automatically:
printf("millis:%lu pitch:%.2f\n", millis(), pitch); // plotted against millistime_s, timestamp, time, millis, micros and t are recognised, with
units taken from the name. Use --time-column NAME to name a different one, or
--no-time-column to force arrival time. A device that reboots and restarts its
counter is re-anchored rather than plotted in the past.
Anything that prints numbers can be plotted:
$ pio device monitor | termscope -
$ cat /sys/class/thermal/thermal_zone0/temp | termscope -
And a single frame can be rendered non-interactively — useful in CI, or for pasting into an issue:
$ termscope --replay run.csv --once 5 > plot.txtEvery plot in this README is produced by exactly that, replaying the capture in
examples/balancing-robot.csv. Because the
capture carries its own timestamps, the frames are byte-identical on every
machine — so CI can check the README is current rather than trusting that
someone remembered to update it:
$ python docs/build_readme.py --checkPlots are drawn with braille glyphs, which pack a 2×4 grid of dots into each character cell — an 80×24 terminal becomes a 160×96 bitmap.
Where braille is not available the plot degrades rather than failing. If your locale encoding cannot represent it (a Chinese or Japanese Windows install defaults to GBK or CP932, neither of which can), termscope switches the output stream to UTF-8; if that is not possible either, it falls back to ASCII:
balancing-robot.csv (replay)                                          snapshot
       ||||||||||||||,,,,:|||||||||:,,,,,,,,,,,,,,,,,,,,,,,,,,,,,,,,,,,,,,,,,:
                     :::::         :|                                        "
                                    "|
     0 ,,,,,,,,,,,,,,,,,,,,,,,,,,,,,,||,::.:.::,,,,,,,.:.:.:.:.:.:.:.:.:,,,,,|
                                      "|        ::""|,                   ,,:,
                                        |,   :::     ::               ,:|"  ::
                                         "::"         ::            |:"      :
                                                       "|         :|
   -20 '    '    '    '    '    '    '    '    '    '    |:   '  :|'    '    '
                                                          |:    ,|
                                                           ":, :|
                                                             """
       -6s-----------------------------------------------------------------now
1*pitch 0.2470   2*motor -9.670   3*vbat 12.36
Colour follows the same idea: 24-bit where the terminal supports it, 256-colour
or 16-colour where it does not, and none at all under NO_COLOR or when the
output is redirected.
The eight series colours are not hand-picked. They are a documented palette, checked by script for lightness band, chroma floor, contrast against the background, and separation under simulated protanopia and deuteranopia. Both the dark and light sets clear every gate:
| worst adjacent pair, CVD | worst adjacent pair, normal vision | |
|---|---|---|
| dark (default) | ΔE 8.4 | ΔE 19.3 |
light (--light) |
ΔE 9.1 | ΔE 19.6 |
Two rules follow from this and are enforced in code:
- A channel's colour is fixed when the channel first appears and is never
reassigned. Hiding one trace does not repaint the others — if you learned
that
pitchis blue, it stays blue. - Hues are never cycled. Past eight channels there is no ninth colour that survives CVD simulation, so extra channels stay hidden until you pick which eight to watch, and the status bar says so.
Colour also never carries a reading on its own: the legend always shows each channel's name and current value as text.
The pieces are separable if you want to plot something that is not a serial port:
from termscope import StreamParser, ChannelSet, Renderer, Palette

parser = StreamParser()
channels = ChannelSet()

for line in my_stream:
    parsed = parser.feed(line)
    if parsed:
        channels.add(parsed.values, time.time())

renderer = Renderer(Palette())
layout = renderer.layout(80, 24, len(channels))
rows = renderer.render_plot_rows(
    channels,
    channels.visible_names(),
    layout,
    lo,
    hi,
    window=10.0,
    now=time.time(),
    x_mode="time",
)The evidence and trade-offs behind serial reconnection and overload handling
are recorded in docs/reconnect-research.md and
docs/overload-research.md. Security reports and
the local-data boundary are covered by SECURITY.md.
Bug reports and pull requests are welcome — see CONTRIBUTING.md. The test suite runs with no dependencies at all:
$ python -m unittest discover -s testsMIT — see LICENSE.