


![]()
heatspot is an ESM TypeScript library for capturing pointer heat data and rendering an embeddable heatmap web component.
Live demo:
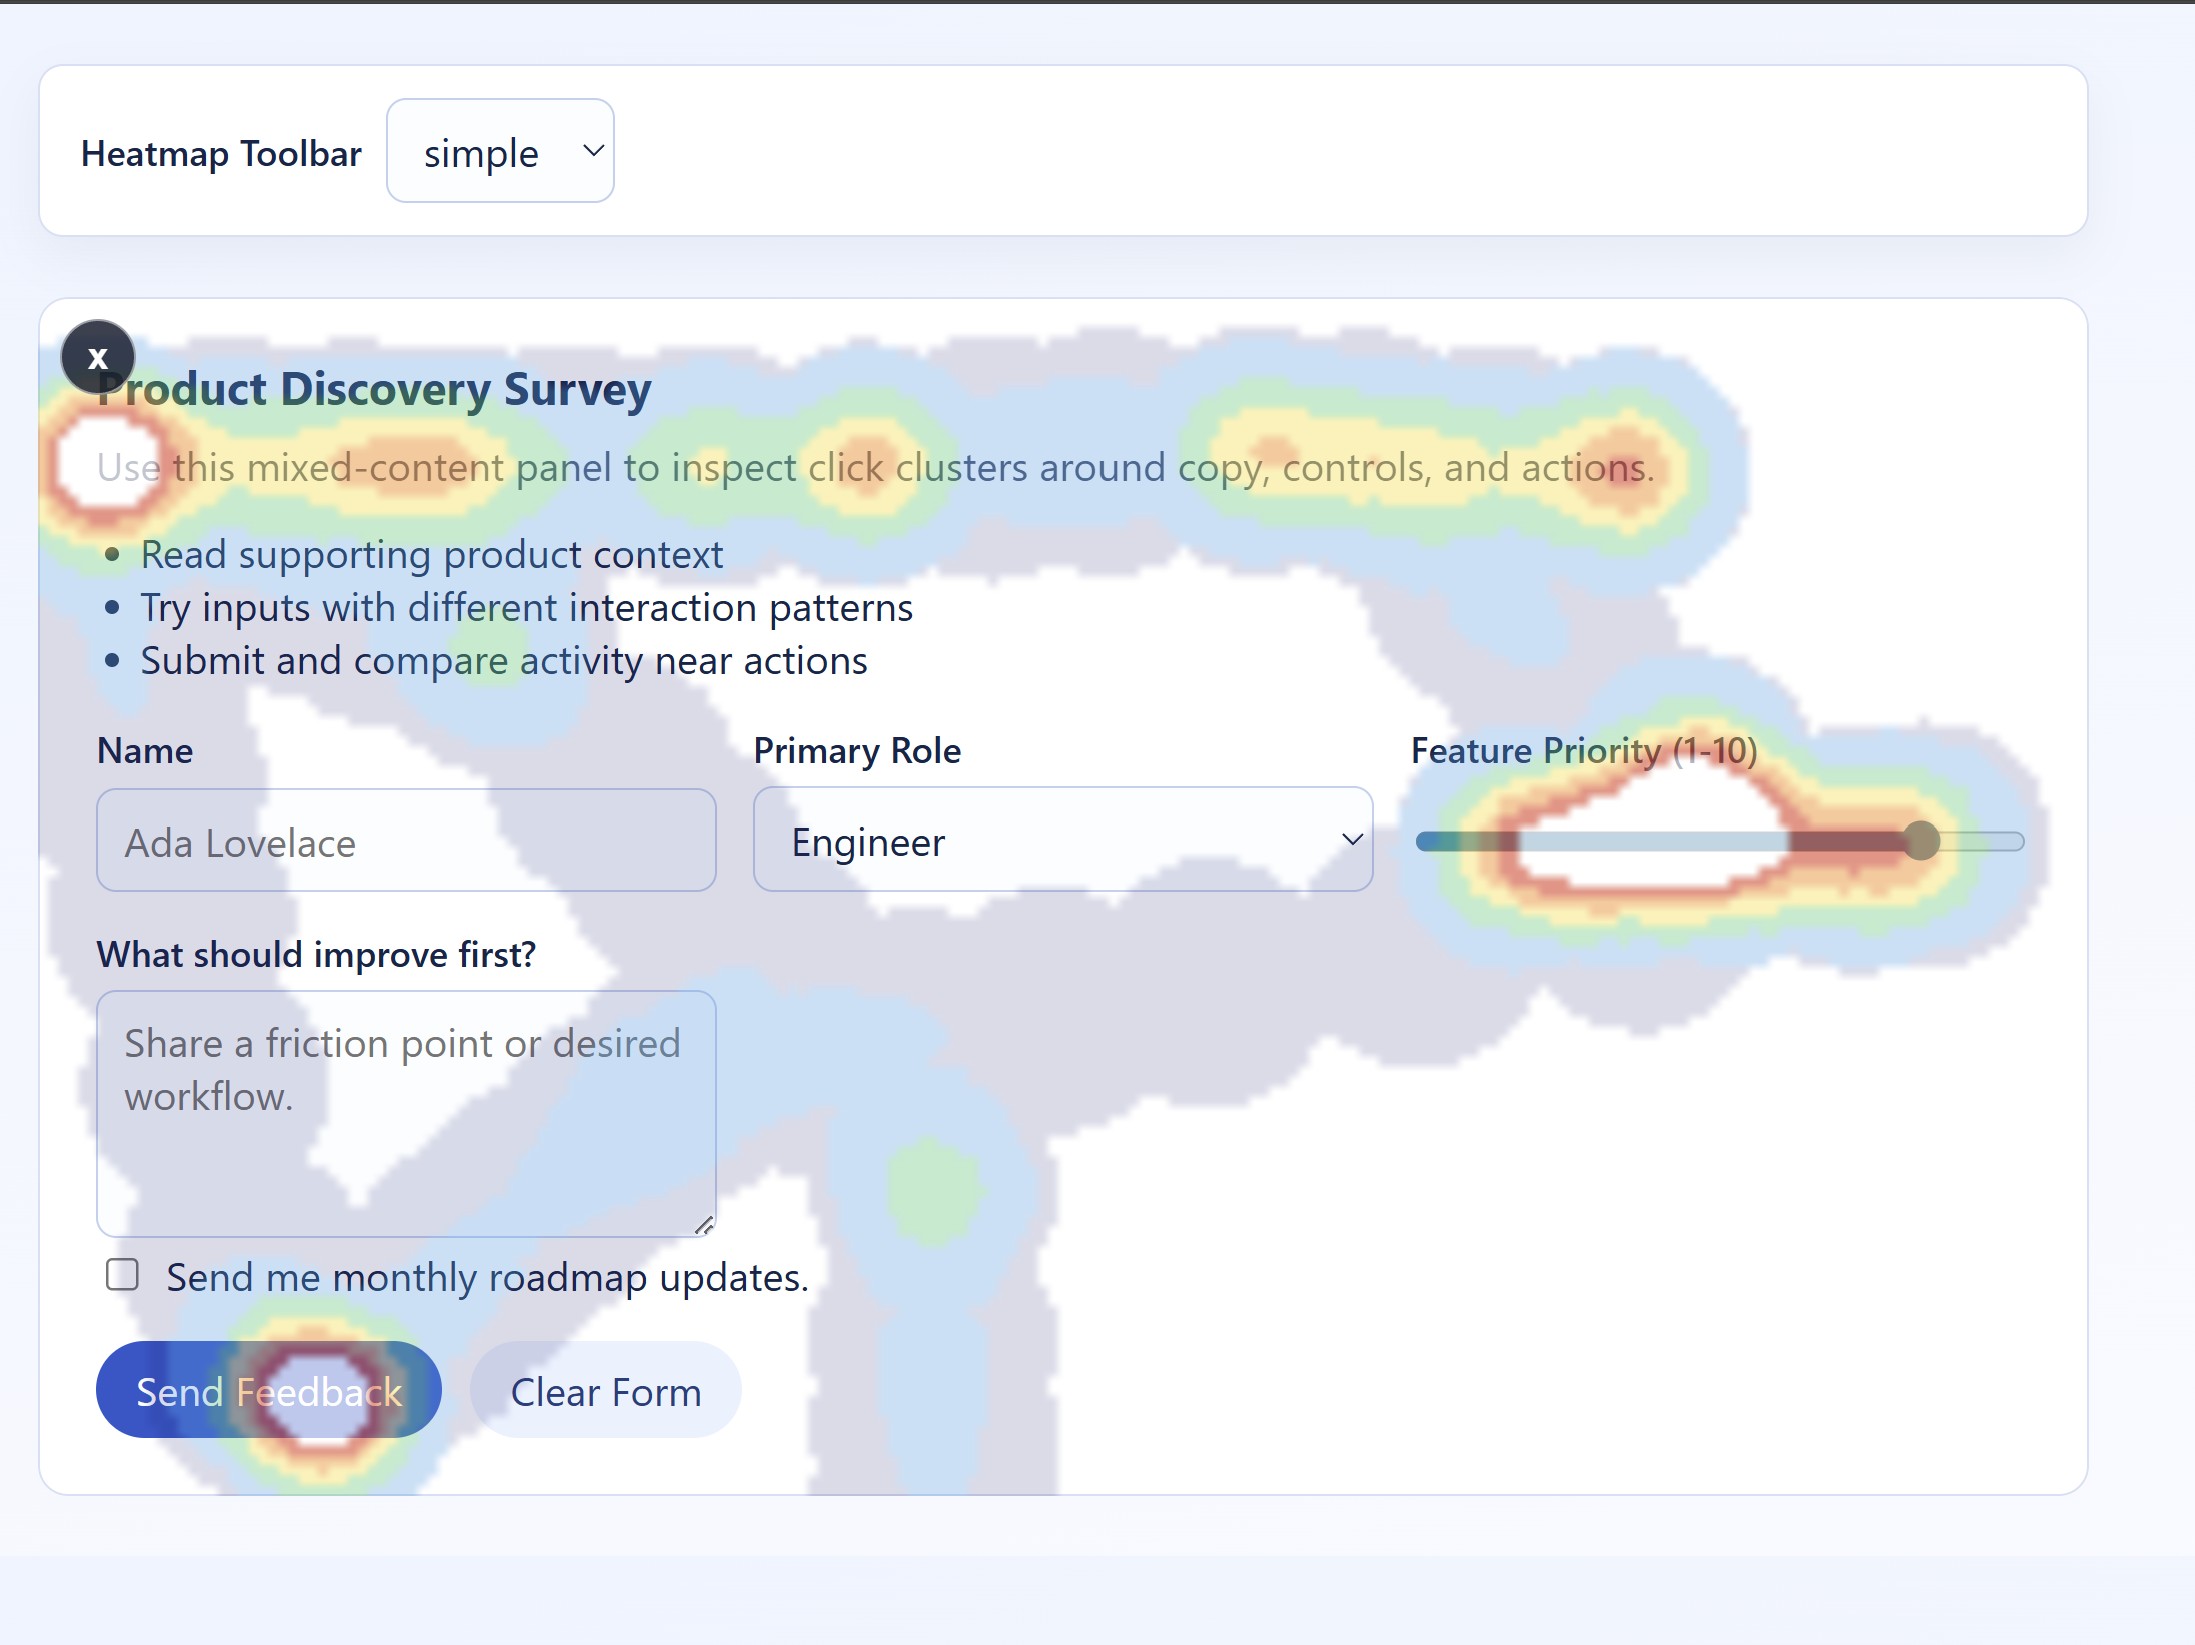
How to try it:
- Open the demo URL.
- Move your cursor around the demo area for a few seconds.
- Click the toggle icon in the top-left of the component to show the heat overlay.
- Continue interacting to see hotspots update in real time.
To run the demo locally:
npm install
npm start
Then open the local URL shown in your terminal (Vite default is usually http://localhost:5173).
- ESM package output with TypeScript declarations
- Pointer heat tracking utility API
- Reusable
<heat-spot>component with slot-based content - Built-in toggle icon (top-left) to show heat overlay
- Configurable
toolbarattribute:simple(default) orhidden
npm install heatspotimport "heatspot";The heat-spot custom element is registered on import.
<heat-spot toolbar="simple">
  <section>
    <h2>Example Panel</h2>
    <p>Move the mouse over this area, then click the icon in the top-left.</p>
  </section>
</heat-spot>
toolbar options:
simple- show the heatmap toggle iconhidden- hide the heatmap toggle icon
Example with hidden toolbar:
<heat-spot toolbar="hidden">
  <section>
    <h2>Passive Tracking Panel</h2>
    <p>The heatmap toggle icon is not rendered in this mode.</p>
  </section>
</heat-spot>const element = document.querySelector<HeatSpotElement>('heat-spot');
const snapshot = element.getHeatmapData();
console.log(snapshot);Example data shape:
{
  "totalSamples": 42,
  "trackedSince": 1741351200000,
  "viewport": { "width": 960, "height": 540 },
  "hotspots": [
    {
      "id": "hs-0",
      "x": 418.2,
      "y": 225.6,
      "count": 18,
      "intensity": 1
    },
    {
      "id": "hs-1",
      "x": 701.1,
      "y": 392.8,
      "count": 9,
      "intensity": 0.5
    }
  ]
}import {
configureMouseHeatmap,
getMouseHeatmapData,
resetMouseHeatmap,
startMouseTracking,
stopMouseTracking
} from "heatspot";
configureMouseHeatmap({ mergeRadius: 24, maxHotspots: 450 });
startMouseTracking();
const snapshot = getMouseHeatmapData();
console.log(snapshot.hotspots);
stopMouseTracking();
resetMouseHeatmap();const element = document.querySelector<HeatSpotElement>("heat-spot");
if (element) {
const imageDataUrl = element.getHeatmapImage();
if (imageDataUrl) {
console.log(imageDataUrl);
// Example prefix:
// data:image/png;base64,iVBORw0KGgoAAAANSUhEUgAA...
// Optional download example
const link = document.createElement("a");
link.href = imageDataUrl;
link.download = "heatmap.png";
link.click();
}
}getHeatmapImage() returns:
- A
data:URL string when the component has measurable dimensions. nullif the element has no measurable surface yet (for example, hidden or not laid out).
npm run build- compile library todist/npm run test- run Vitest testsnpm run test:coverage- run tests with coverage reports incoverage/npm run build:verify- run tests and harness buildnpm run pack:check- show package contents usingnpm pack --dry-run
npm install
npm startMIT