This repository contains custom intake drivers that are used in the tethys dashboard app for creating custom visualizations.
Refer to this documentation for more information on how to develop new dashboard plugins.
Type: table
Description: Provides information from the NWPS API for gauge impact statements

Type: image
Description: Depicts the 10 day ensemble based streamflow volume accumulation

Type: image
Description: Depicts the 10 day ensemble based hourly maximum streamflow probability

Type: image
Description: Depicts the 10 day ensemble based daily maximum streamflow probability

Type: image
Description: Depicts the monthly ensemble based streamflow volume exceedance probabilities

Type: image
Description: Depicts the 5 day ensemble based streamflow volume exceedance probabilities

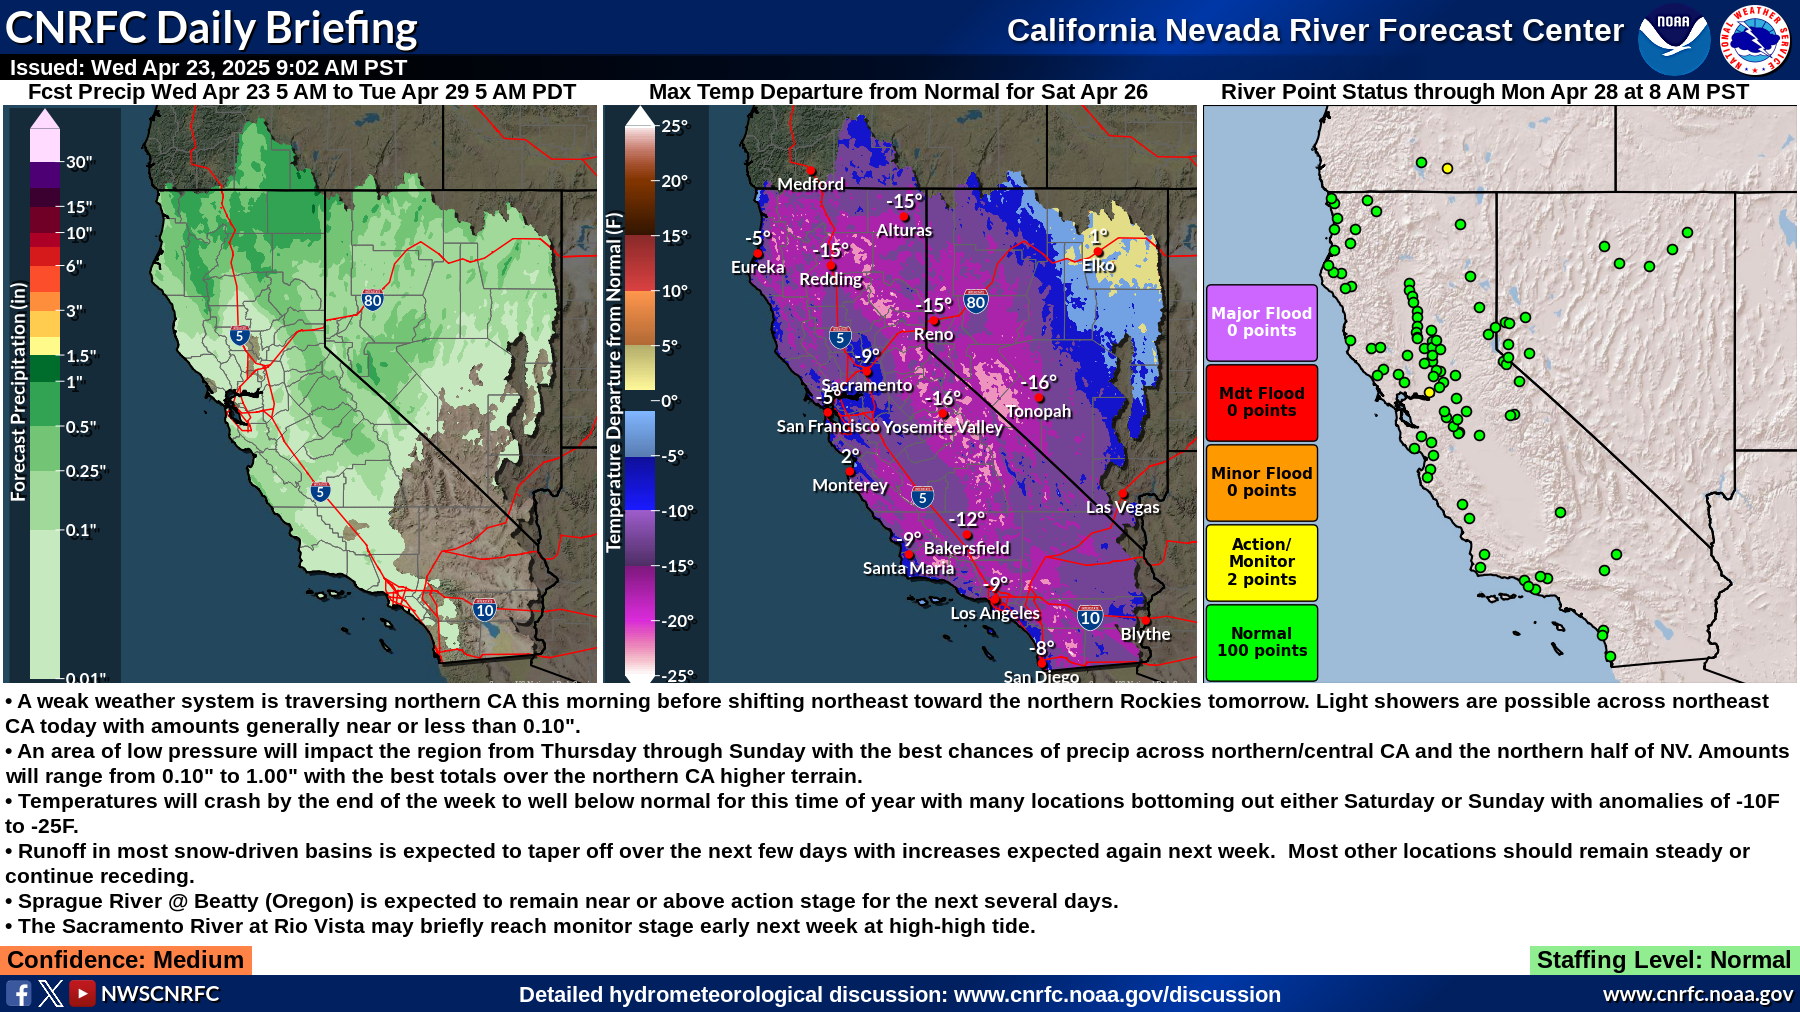
Type: image
Description: Depicts the CNRFC daily briefing
Type: plotly
Description: Depicts the observed, deterministic, and ensembled based statistical streamflow forecasts
