This repository contains custom intake drivers that are used in the tethys dashboard app for creating custom visualizations.
Refer to this documentation for more information on how to develop new dashboard plugins.
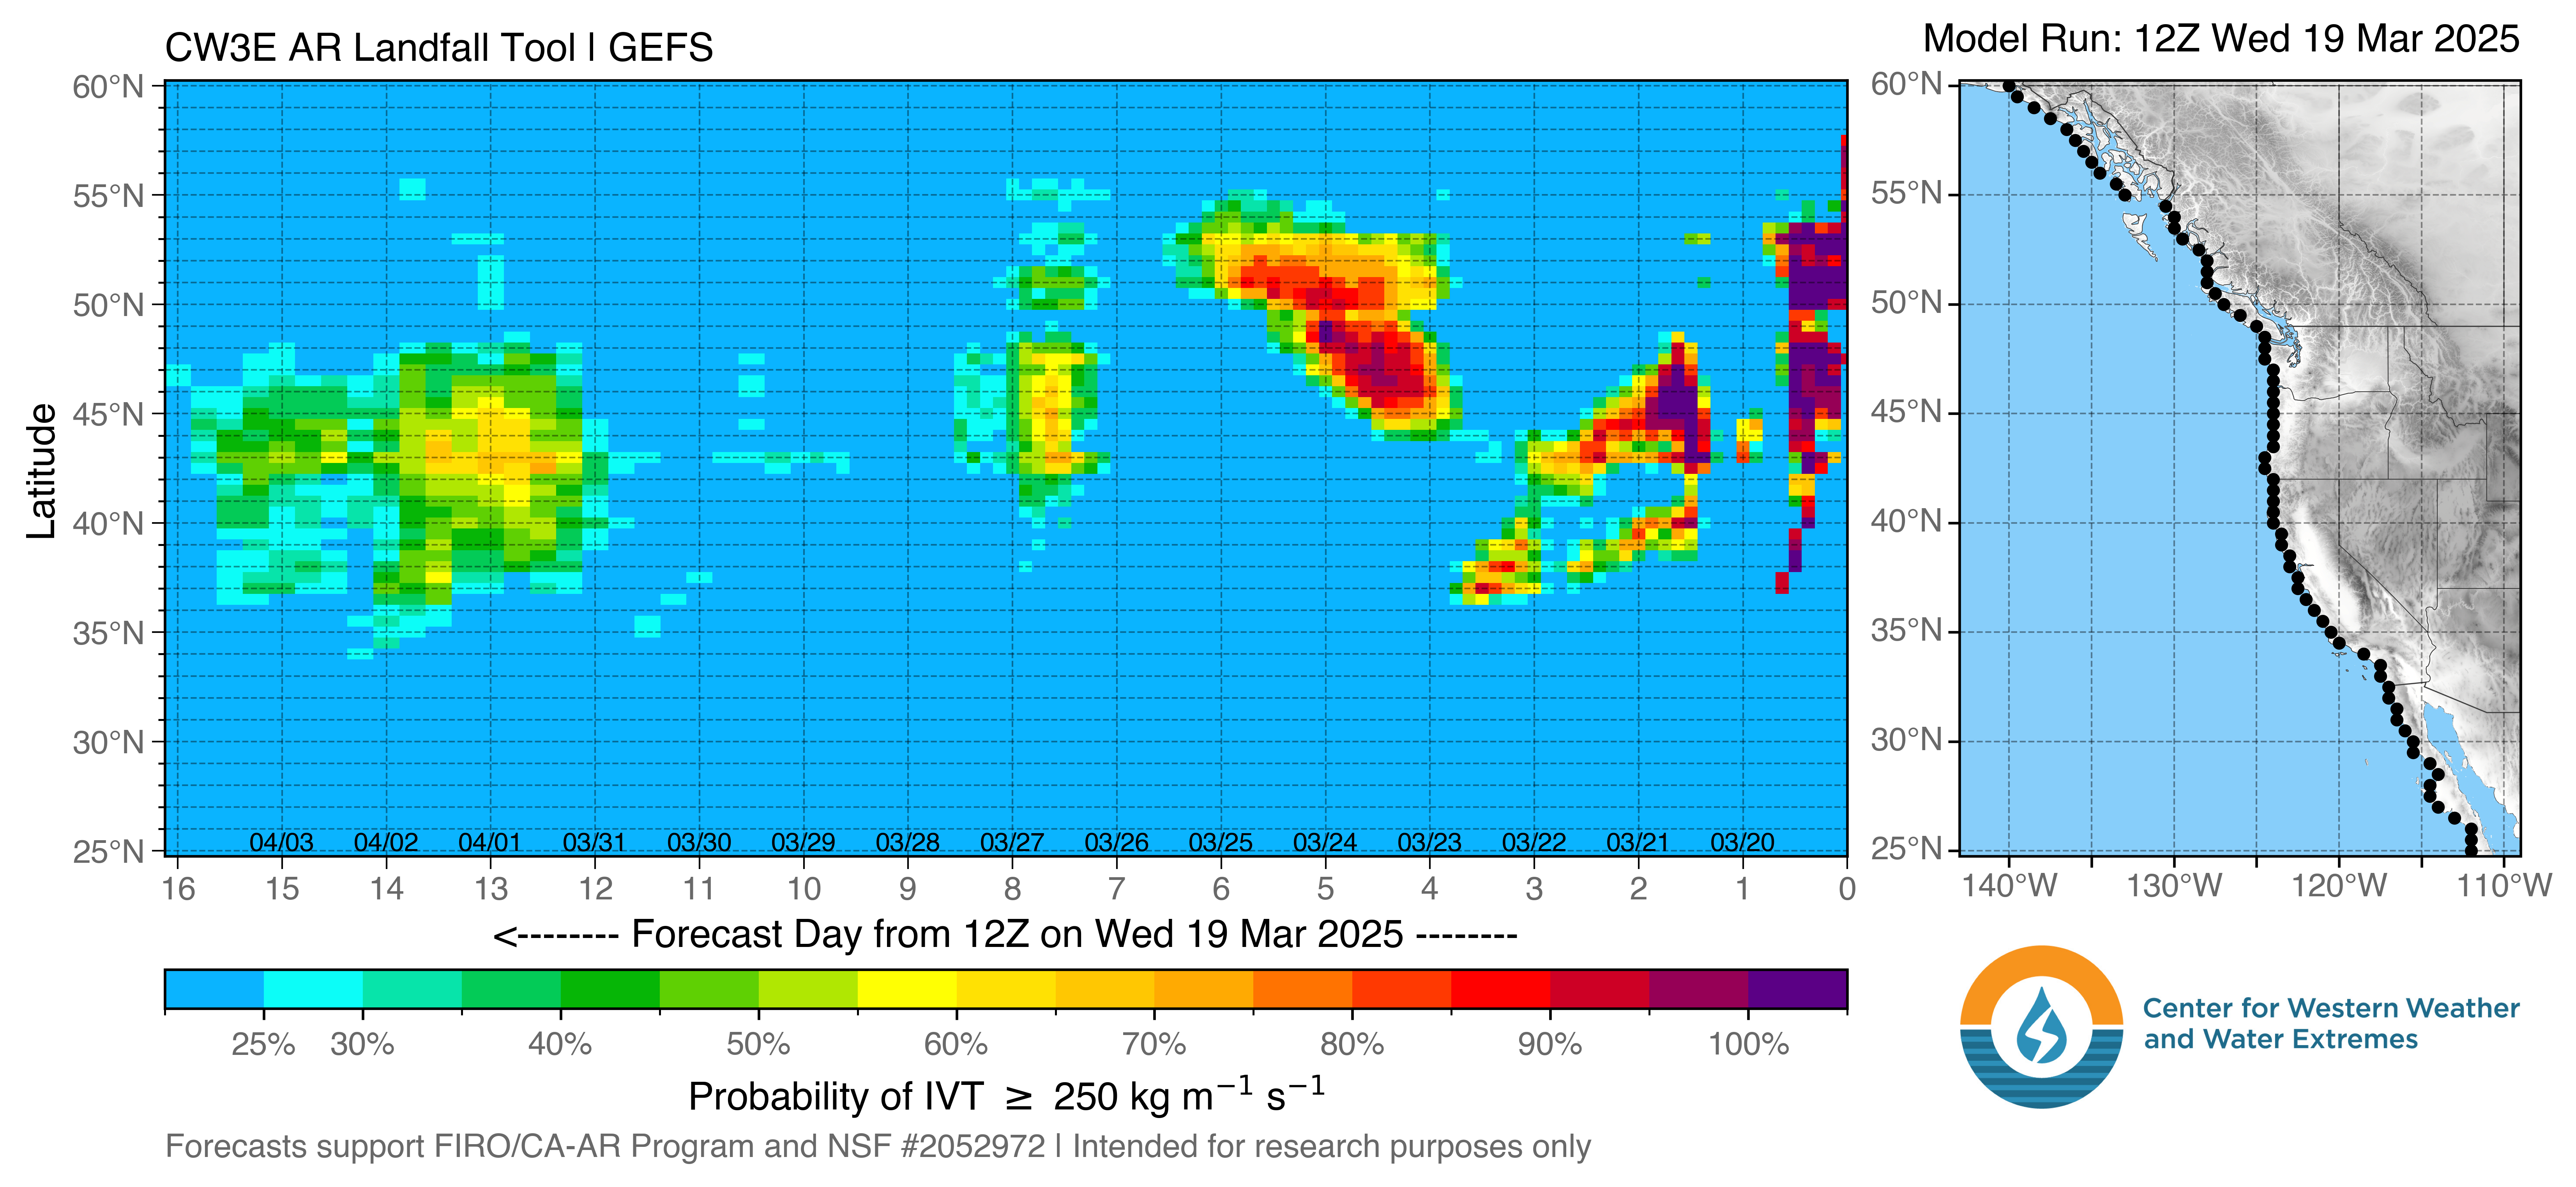
Type: image
Description: Displays the likelihood and timing of AR conditions at each point on the map in a line along the U.S. West Coast or inland derived from the NCEP GEFS model over the next 16 days
Type: image
Description: A HUC8 based table or chart containing QPF statistics for various precipitation models.


