


Publication-quality scientific illustration in pure matplotlib — no BioRender, no Illustrator.
Overview figures and architecture diagrams are usually drawn by hand in a subscription tool. That makes them pretty, but also unreproducible: you cannot diff them, you cannot regenerate them when the numbers change, and you cannot put them under version control.
sciglyph gives you the primitives to draw the same figures as code.
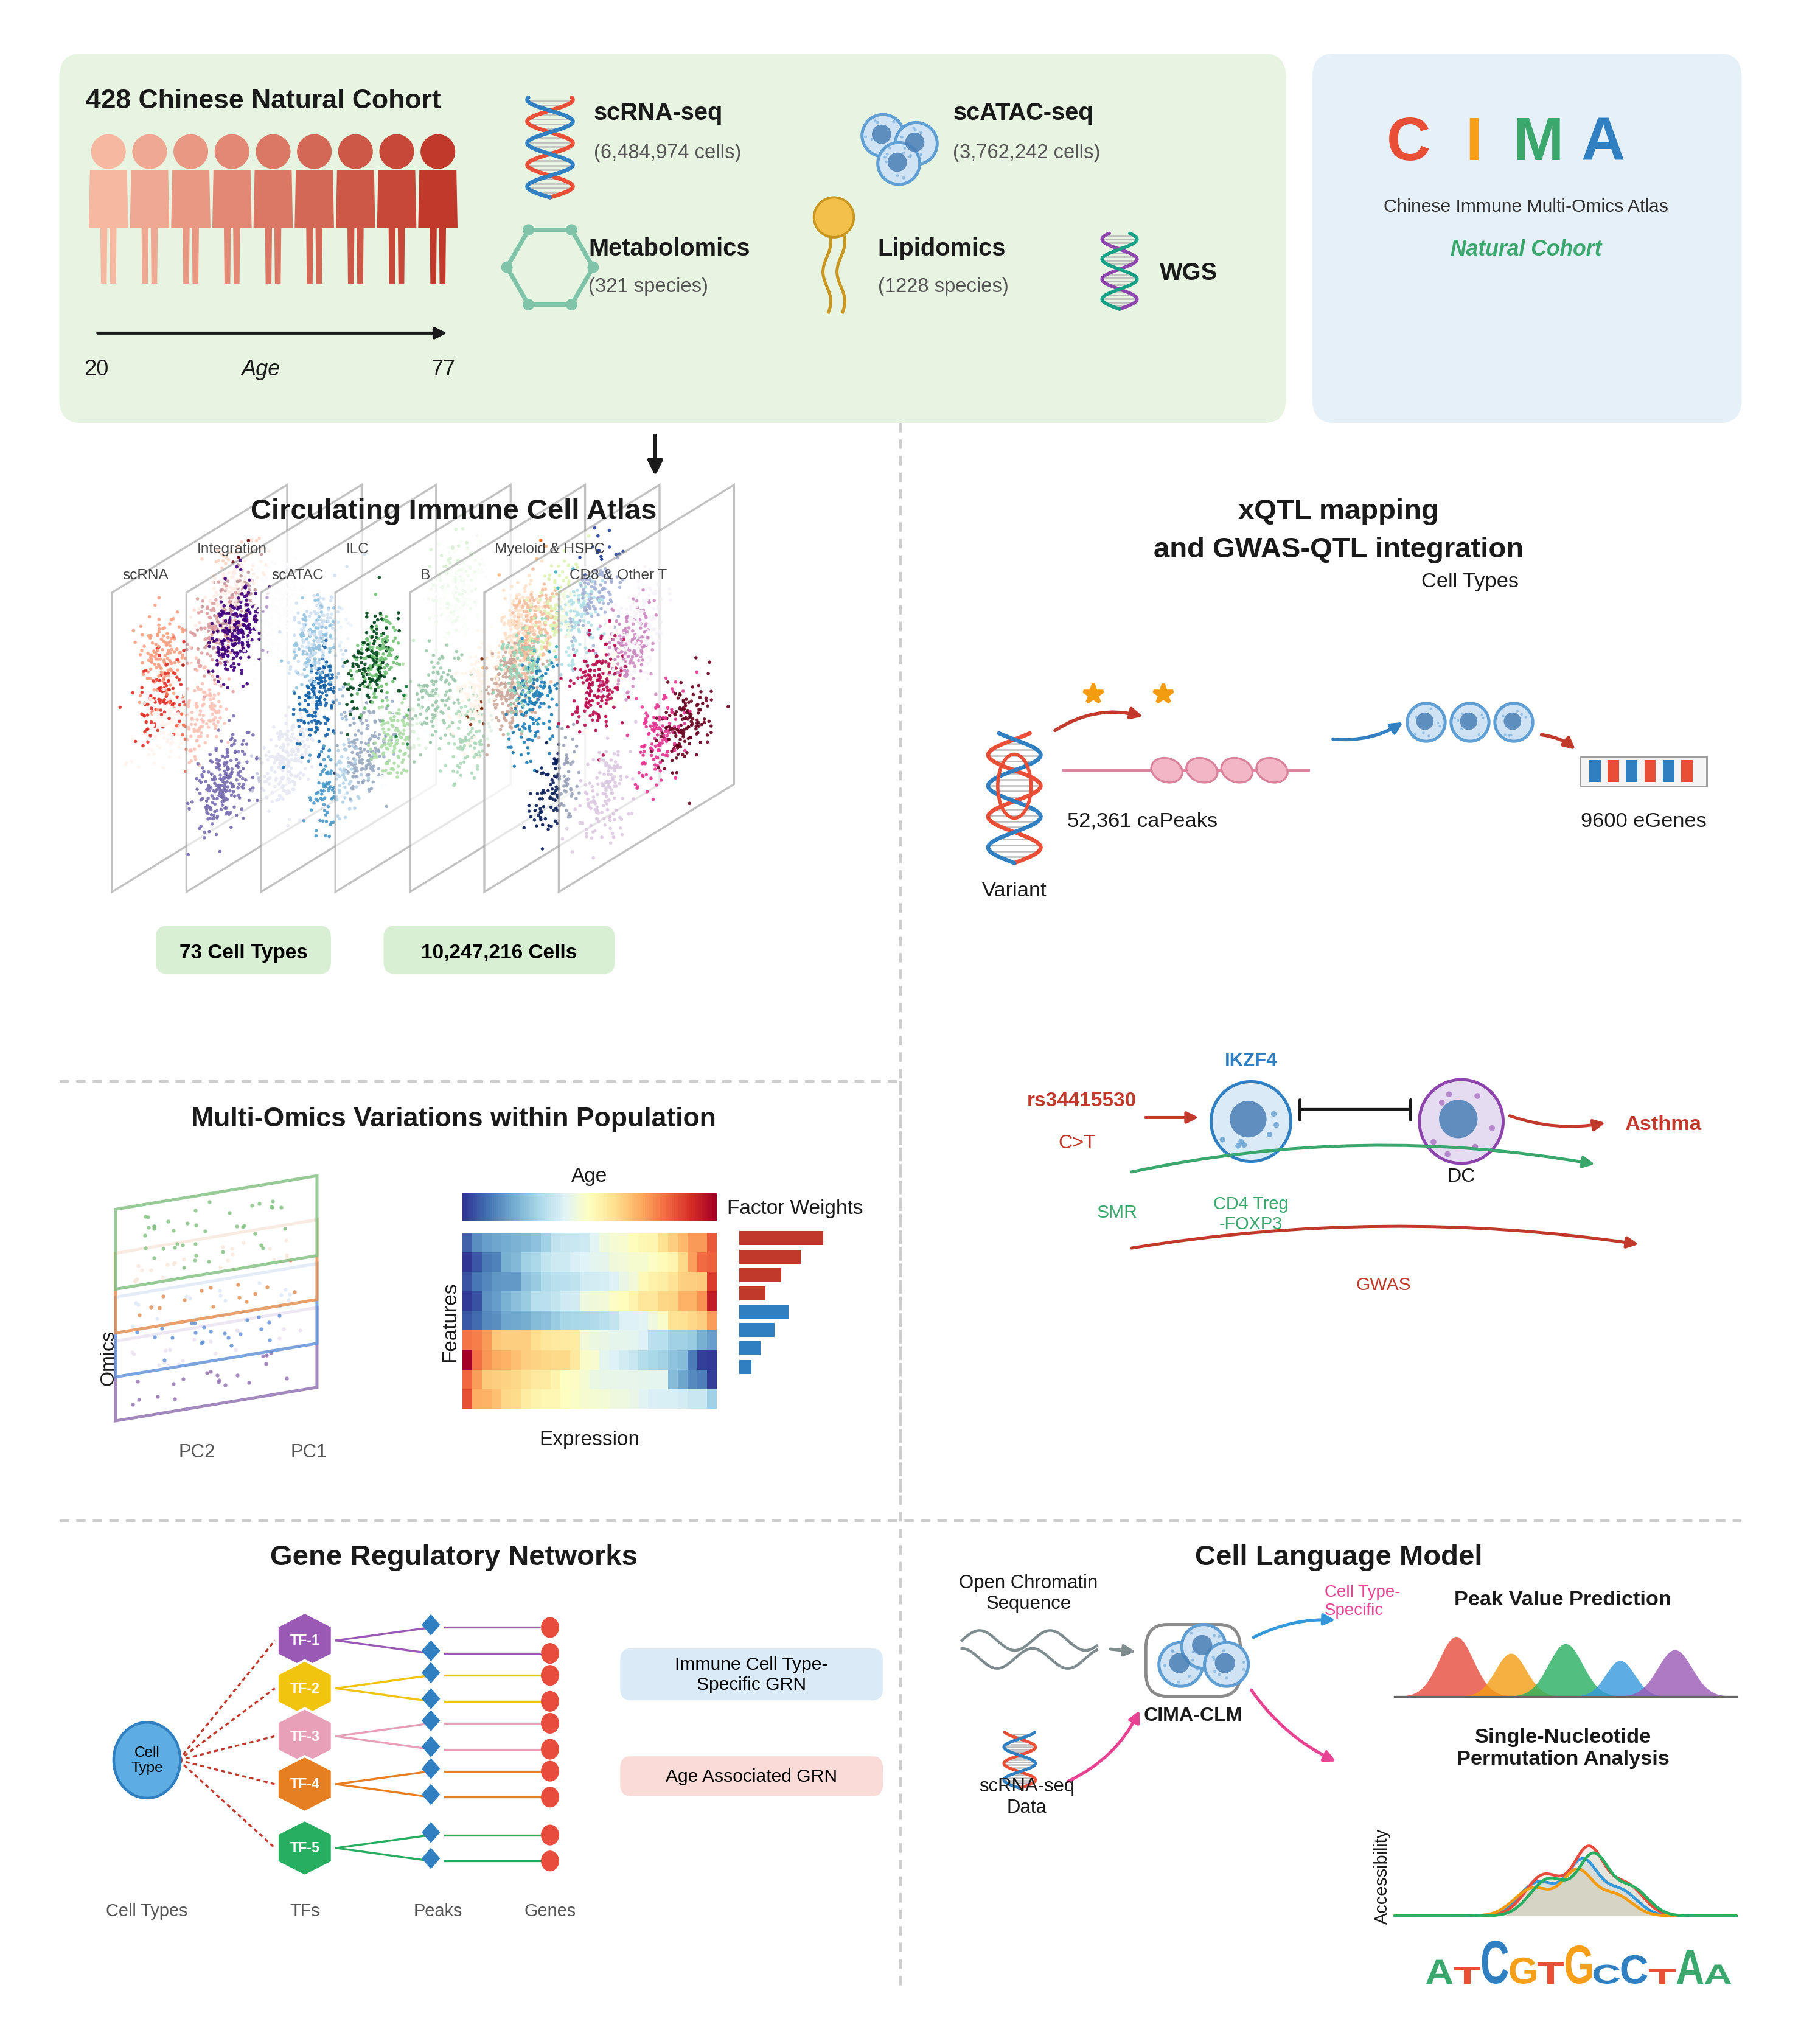
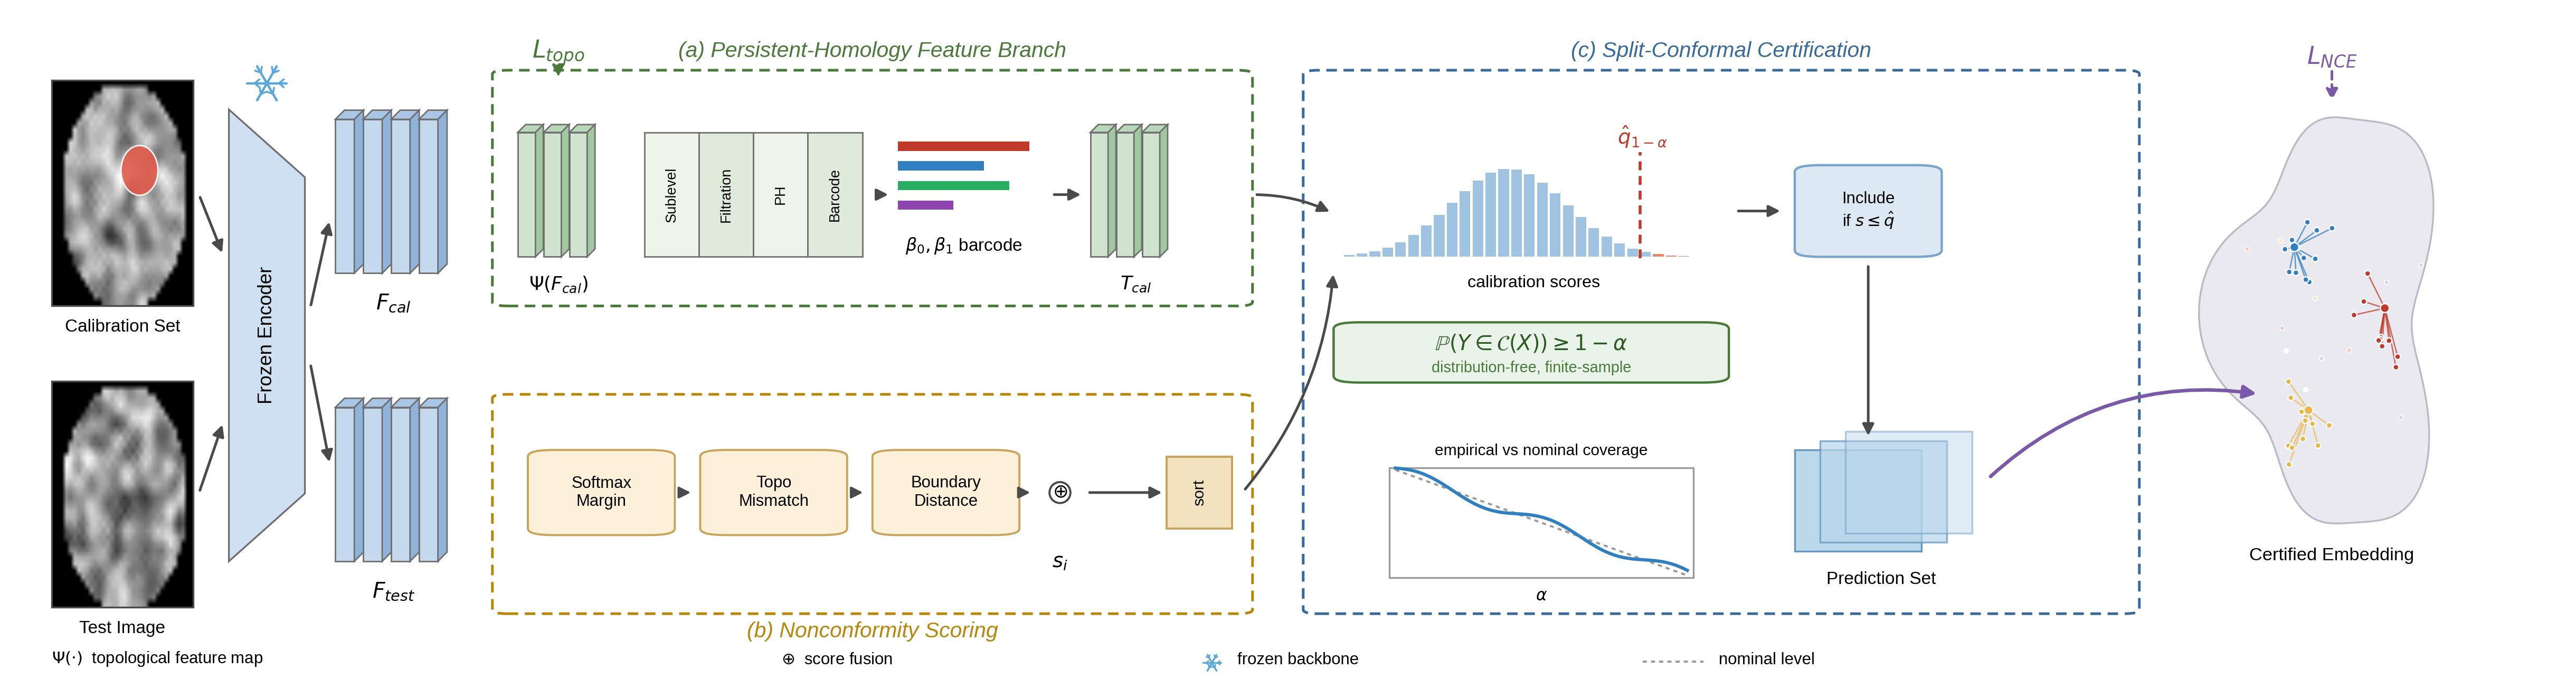
Both figures above are generated by the scripts in examples/ — nothing was touched by hand. The content is synthetic; swap in your own numbers and the layout carries over.
| subscription tools | sciglyph |
|
|---|---|---|
| Reproducible | ✗ manual pixel-pushing | ✓ a script |
| Version control | ✗ binary blobs | ✓ diffable source |
| Data-driven | ✗ retype every number | ✓ read straight from your results |
| Vector output | ~ depends on export | ✓ PDF/SVG with editable text |
| Cost | subscription | free, MIT |
For a one-off figure, often yes, and faster — you describe it, you get a script, you move on. If that is the whole job, do that.
What no model can do is look at what it drew. Drawing has a second half, and it is the half that fails silently:
ax.add_patch(Circle((.2, .5), .06)) # on a 12 x 3.2 canvasThat is what a from-scratch script writes, and it is what almost every model writes, because it is what the matplotlib docs show. It renders 216 x 58 px — an ellipse stretched nearly four to one. Nothing raises an error. The script ran fine.
This library is the other half. Its primitives already carry the aspect
correction; report() measures the drawn figure and names overlapping labels
and characters your submission font cannot render; consort.figure() refuses to
draw participant counts that do not add up.
The honest evidence is the author's own. Every figure in this repository was
drawn with these tools, and building them still produced: two circles that came
out as ellipses, a DNA helix sitting on top of its own caption, an emoji that
became a tofu box, and two labels overlapping at 69%. The checks caught the last
two. Rendering the image and looking at it caught the rest — which is the honest
ceiling here, and why report() prints a line saying so.
So the two are not alternatives. Have your agent install this and call the checks before it saves:
from sciglyph import bio, arch, set_canvas, report, RC
plt.rcParams.update(RC)
set_canvas(fig)          # the correction a from-scratch script omits
...
report(fig, ax) # then look at the PNG anywaypip install sciglyphOnly matplotlib and numpy. Nothing else.
import matplotlib.pyplot as plt
from sciglyph import bio, set_canvas, report, RC

plt.rcParams.update(RC)
fig = plt.figure(figsize=(7.2, 3.0), dpi=300)
ax = fig.add_axes([0, 0, 1, 1]); ax.set_xlim(0, 1); ax.set_ylim(0, 1); ax.axis("off")
set_canvas(fig)                      # required on non-square canvases

bio.person(ax, .08, .55, s=.30)
bio.dna(ax, .25, .55, w=.05, h=.45, n=2)
bio.cell(ax, .42, .55, r=.06, seed=1)
bio.seq_logo(ax, .60, .40, [("A", .6), ("C", .9), ("G", .4), ("T", .7)], w=.03)

report(fig, ax)                      # catch text collisions before saving
fig.savefig("figure.pdf", bbox_inches="tight")
That block is runnable as it stands — it saves figure.pdf and prints the layout
report on the way.
The two full examples behind the images above live in the repository rather than the wheel, so they need a clone:
git clone https://github.com/GuoCheng24/sciglyph && cd sciglyph
python examples/overview_figure.py    # -> gallery/overview_figure.png
python examples/architecture.py # -> gallery/architecture.pngEvery trial and most cohort papers need one, and journals require it for randomised trials. R has three packages for it; Python has had none, and the standing advice was to draw the boxes yourself in matplotlib.
from sciglyph import consort

fig, problems = consort.figure(
    spine=[("Assessed for eligibility", 1327),
           ("Enrolled", 915),
           ("Allocated to treatment", 458),
           ("Included in the primary analysis", 441)],
    excluded=[[("Did not meet inclusion criteria", 289),
               ("Declined to participate", 78),
               ("Other reasons", 45)],
              [("Allocated to the comparator arm", 457)],
              [("Lost to follow-up", 11), ("Withdrew consent", 6)]],
)
fig.savefig("consort.pdf", bbox_inches="tight")
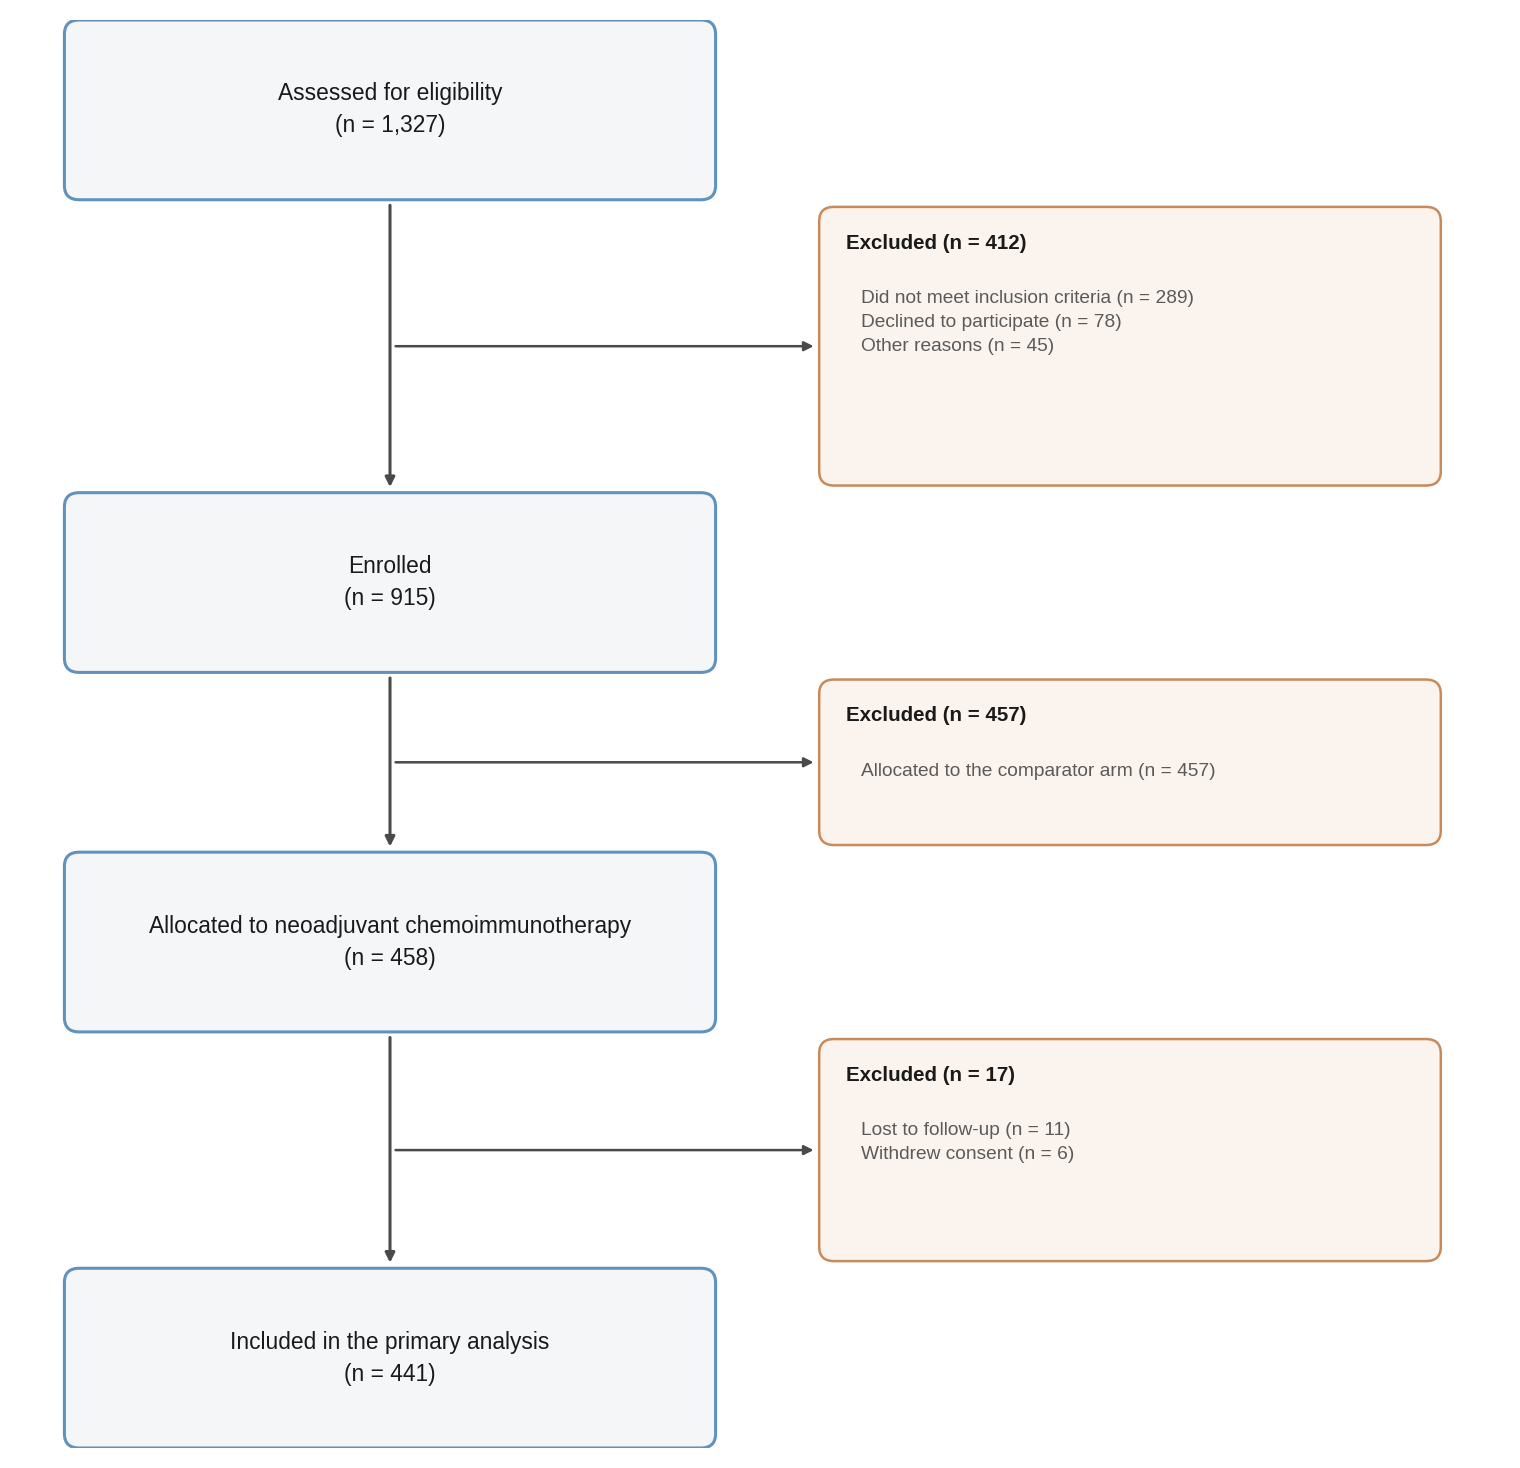
The reason to draw one in code is that the numbers move: you re-clean the data, forty patients leave the eligible set, and the figure goes stale — silently, because nobody re-adds the boxes by hand.
So it does the thing a drawing tool can do that a drawing surface cannot. It checks that the counts reconcile, and refuses to draw a flow that does not:
the flow does not reconcile — 1 step(s) do not add up:
  step 1  'Assessed for eligibility' (1327) -> 'Enrolled' (900), excluded 367: unaccounted for 60
Fix the counts, or pass strict=False to draw it anyway.
Reviewers check that addition. Failing here is cheaper than failing there.
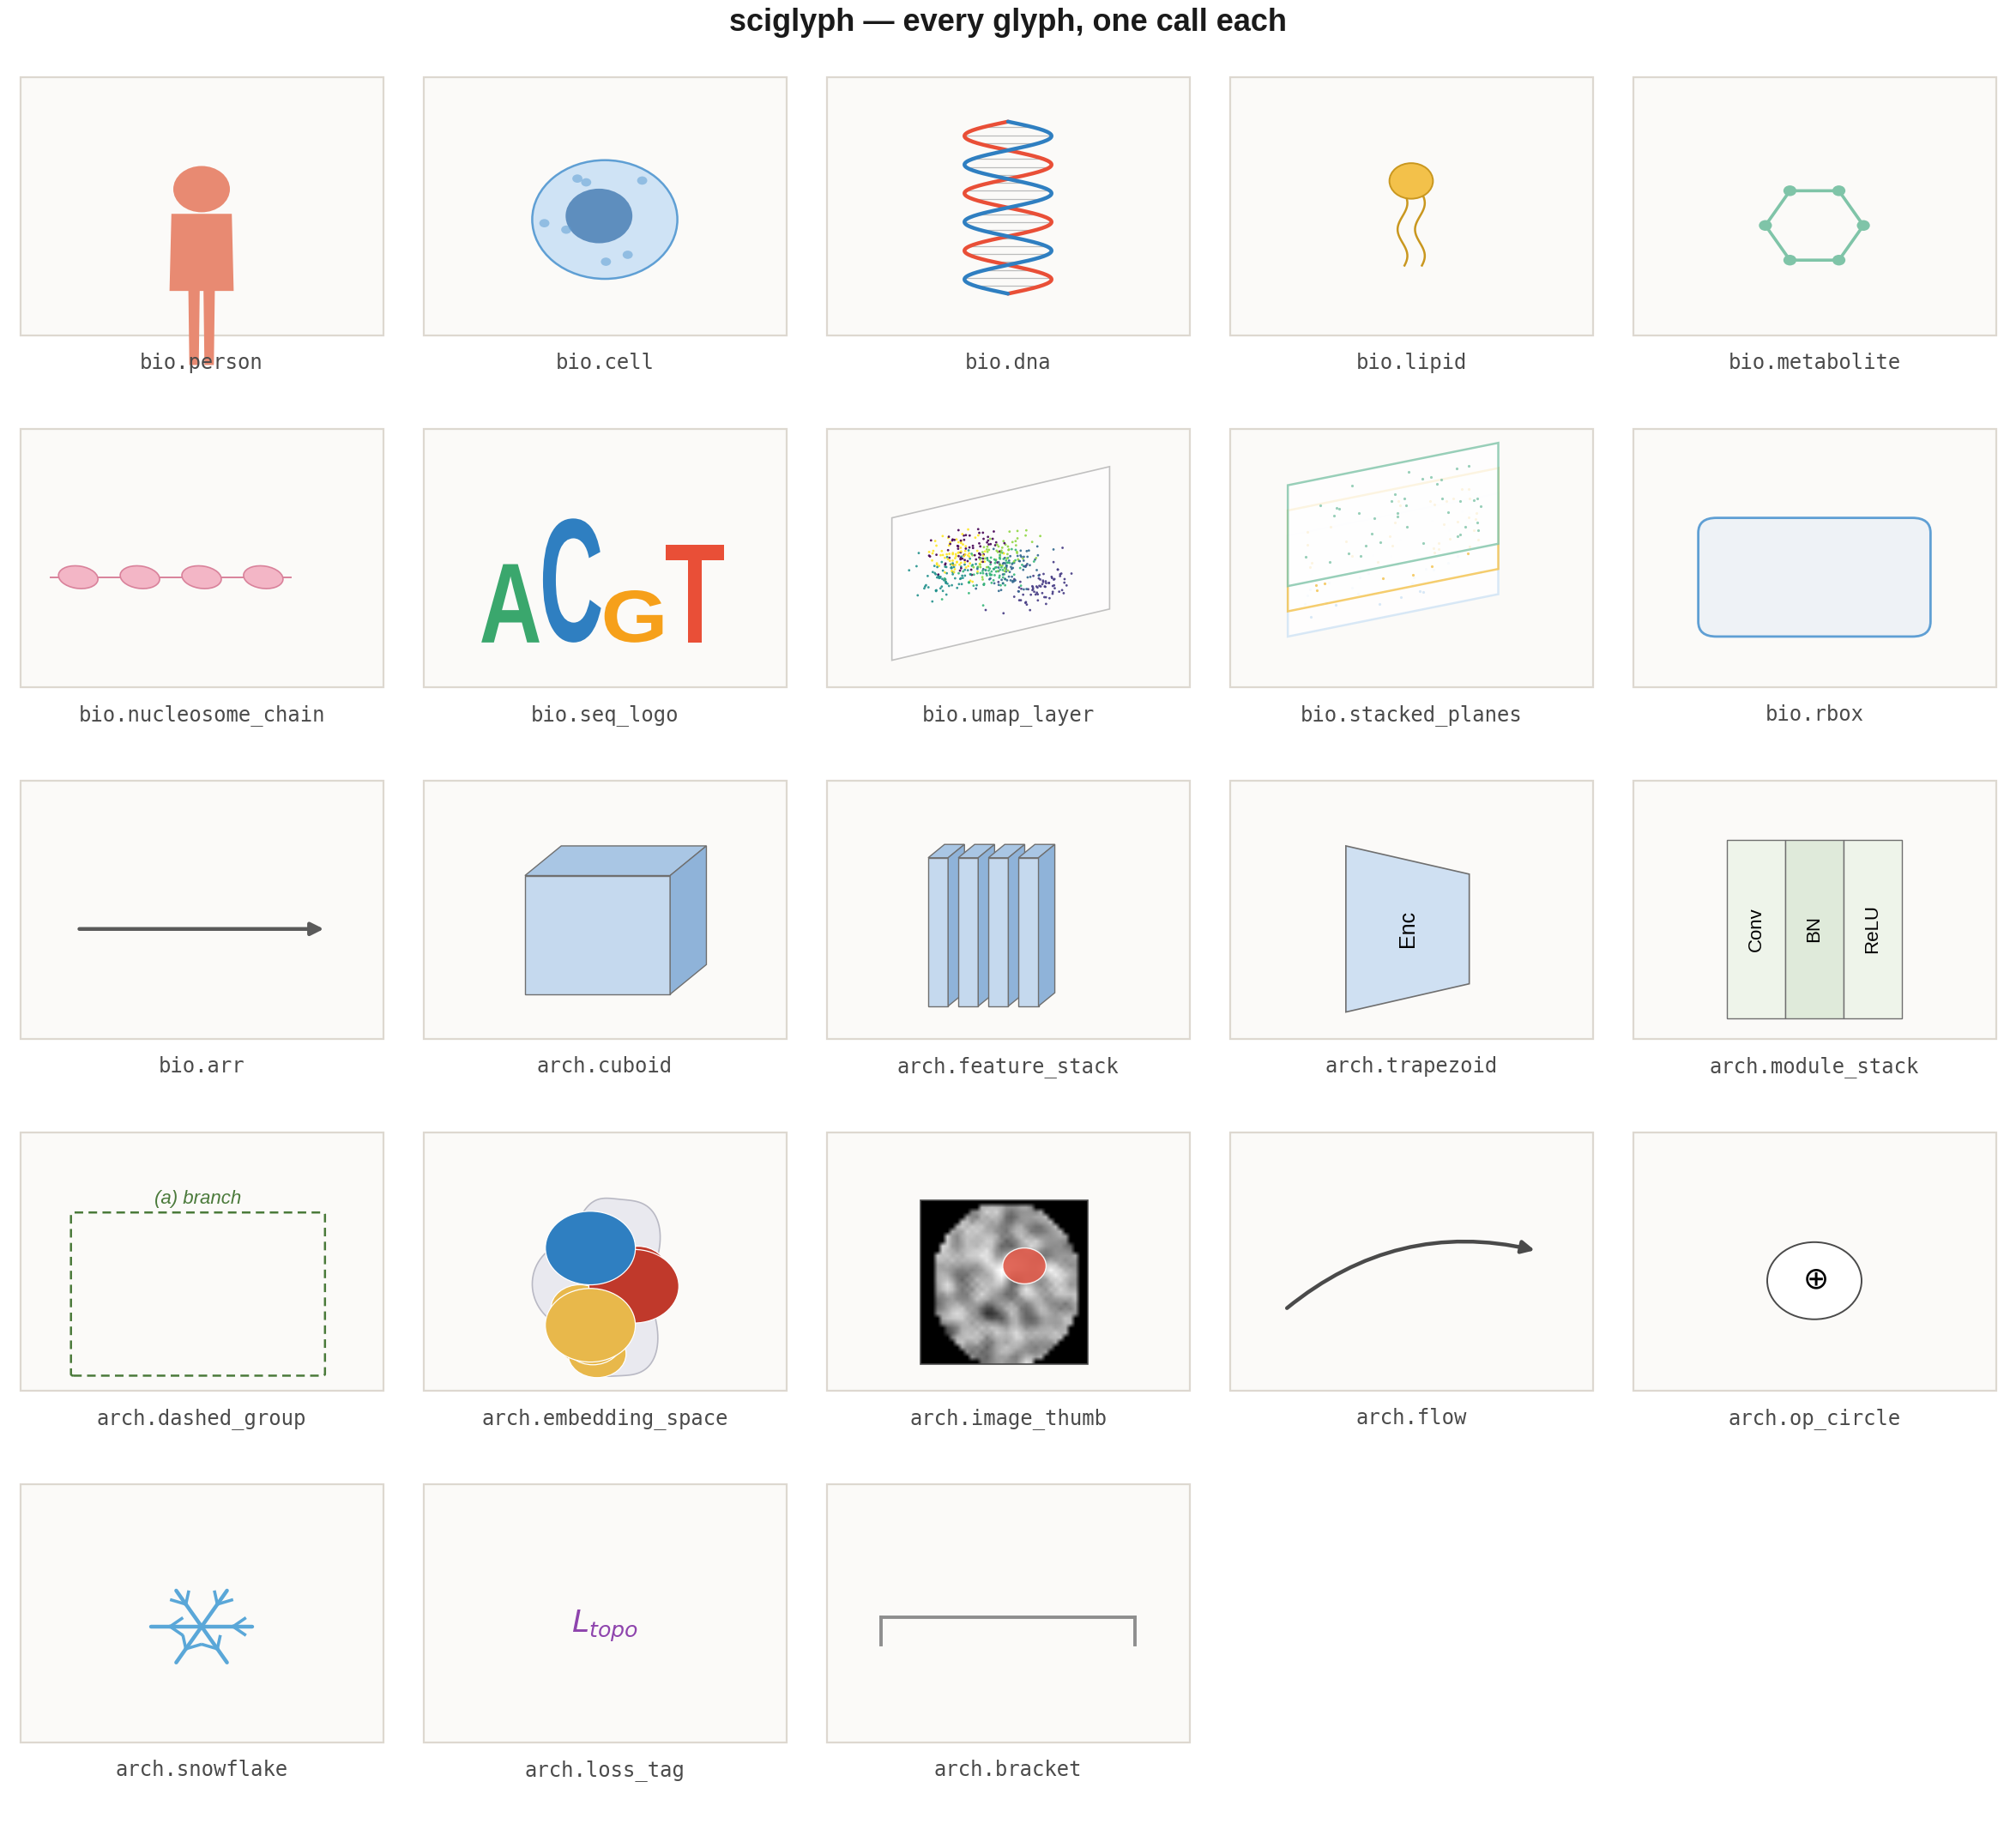
The catalogue itself is drawn by the library — docs/glyph_sheet_figure.py regenerates it, and a glyph that breaks shows up as a broken cell rather than a silently stale image.
sciglyph.bio — glyphs for Nature/Science-style overview figures:
person (cohorts) · dna · cell · lipid · metabolite ·
nucleosome_chain · umap_layer (the stacked atlas look) ·
seq_logo (information-scaled letters, no logomaker needed) ·
stacked_planes · rbox · arr
sciglyph.arch — glyphs for architecture diagrams:
cuboid / feature_stack (3-D feature blocks) · trapezoid (encoders) ·
module_stack (Conv|BN|ReLU bars) · dashed_group (the (a)/(b)/(c)
language) · flow · op_circle · snowflake (frozen backbone) ·
image_thumb · embedding_space (contrastive panels) · loss_tag · bracket
sciglyph.layout — pre-flight collision detection.
When a figure breaks, it is almost never the artwork — it is the layout.
report() uses the real rendered bounding boxes to find overlapping text, so
you do not have to hunt for it by eye:
report(fig, ax)
# [sciglyph.layout] 36 text objects
#   ! 'CD4 Treg/-FOXP3' x 'SMR' overlap 92%
It also works from the command line on any script that exposes fig and ax:
python -m sciglyph.layout my_figure.pyIt checks three things, each of which shipped a broken figure before it existed:
| check | what it catches |
|---|---|
| text overlap | two labels drawn over each other |
| artwork overlap | a row of boxes laid out slightly too wide, so each one covers its neighbour — the strings may not overlap at all, so text-level checks miss it entirely |
| missing glyphs | a character the font cannot draw, rendered as an empty box. Symbols typed as literals (✓, ❄) are the usual casualty |
Two kinds of overlap are deliberately not reported, because they are the layout working: a panel containing its contents, and an unfilled dashed shape — a ring drawn around the thing it annotates.
These are geometric checks. Whether the figure actually reads well still needs your eyes.
- Call
set_canvas(fig). In[0,1]coordinates a "circle" isr·Wwide andr·Htall. On a 12×3 canvas, every circle becomes a rugby ball. - Anchor arrows to what
feature_stackreturns, not to hard-coded coordinates — otherwise changing the number of blocks silently breaks them. - Never put symbol codepoints in figure text.
❄(U+2744) is missing from most sans fonts and renders as a tofu box. Draw it (arch.snowflake). - Overlapping translucent fills blend into one muddy colour. Keep the fill
under
alpha=0.15, stroke each curve, and offset the peaks. Tuning alpha alone will not save you. - Fonts: Arial/Helvetica are often absent on Linux.
RCfalls back to Liberation Sans (metric-compatible with Arial) and setspdf.fonttype=42so text stays editable in the PDF — a hard requirement at most journals. - Don't move elements toward whitespace. Whitespace relocates, it does not disappear. Decide which row an element belongs to, move it as a group, then verify with the quadrant ink distribution.
This gets you clean flat schematics combined with data panels — the register of a Nature/Science overview figure or a TPAMI architecture diagram. It will not reproduce hand-drawn illustration (shaded organs, textured cells, gradients). For that, embed a CC-BY asset and cite it rather than fake it.
Guo Cheng, University of Chinese Academy of Sciences — medical imaging and machine learning methods. This tool came out of needing to regenerate a figure every time the numbers changed, and not wanting to redraw it by hand each time.
Corrections, bug reports and feature requests all go to Issues. Please open one rather than emailing: a public answer helps whoever hits the same thing next, and it is searchable.
Written while trying to get papers out, so they tend to be useful at the same points in that process:
- scholarcheck — verify that a citation actually exists, and audit a whole .bib in CI
- docxaudit — find what your converter silently dropped from a .docx
- world-model-map — a map of open-source world models and where their authors say they break
- kakeya-conjecture-lab — an interactive lab for the Kakeya conjecture, with a box-counting meter
MIT © Guo Cheng