
-
In this Readme file we're going through the analysis of a video games sales dataset, as well as enriching it with demographic data using world bank's API, so that we can establish any potential correlations between the two datasets.
-
the sources used for this analysis :
- Dataset from https://www.kaggle.com/datasets
- API from https://data.worldbank.org/indicator/SP.DYN.CBRT.IN
The data set used in this project contains information about the release and sales of video games in 4 different regions (North America, EU, Japan, and others), as well as information about games genre and publishers, over the years from 1980 until 2020.
* What is a video game?
A video game is an electronic game that can be played on a computing device, such as a personal computer, gaming console. Depending on the platform, video games can be subcategorized into computer games and console games. In recent years, however, the emergence of social networks, smartphones and tablets introduced new categories such as mobile and social games. Video games have come a long way since the first games emerged in the 1970s. Our dataset does not include mobile platform.
* Dataset fields and data types are:
- Rank - Ranking of overall sales.
- Name - The games title.
- Platform - Platform of the games release (i.e. PC,Wii,PS2 etc.).
- Year - Year of the game's release.
- Genre - Genre of the game ,object.
- Publisher - Publisher of the game, object.
- NA_Sales - Sales in North America (in millions).
- EU_Sales - Sales in Europe (in millions).
- JP_Sales - Sales in Japan (in millions).
- Other_Sales - Sales in the rest of the world (in millions).
- Global_Sales - Total worldwide sales.
After going through some cleaning, which mostly involved dropping null values from the dataset, we start our analysis, and answering some questions. Mainly, how popular video games got over the years in term of sales
- Which genre is the most popular?
- Per release, sales, and region.
- Which is the most popular platform?
- Per release, sales.
- Did Video games poularity increased over the years ?
- Which year had the most sales?
- In which region they got the most popular?

After we answer the question above, we are going to the next step of this project, which is crossing our dataset with data from World bank about birth rate using API, we are going to look for some correlations between birth rate and video games popularity.
In 12 video game genre, the most popular one globally is Action followed by Sports.
- Action games releases represent 20% followed by Sports 14.14% of the global releases.

In the same collection of genre, the Action games are still the most popular followed by Sports games represent of the global sales
- Action games sales represent 19.55% followed by Sports 14.85% of the global sales.

Action games give players a chance to do and experience things that they may not have the chance to in real life, that's what makes them so popular in my opinion
The most popular platform in term of releases globally is DS ( Nintendo) followed by PS2 (Sony) DS 13.09% PS2 13.06%

In term of sales PS2 is number one globally with 14% sales , compared to X360 ( by Microsoft) second that comes second with 11% sales.

Globally the most sales and releases were in the years between 2007 and 2010 gradually

the year with the most releases and sales is 2008 followed by 2009

with North America the region with the most popularity
We are getting data from the website World Bank using API. The data we are intested in, is the birth rate globally and per region ( according to regions we have in our dataframe)
*For global birth rate --> https://api.worldbank.org/v2/country/WLD/indicator/SP.DYN.CBRT.IN?format=json.
*For North America birth rate --> https://api.worldbank.org/v2/country/NAC/indicator/SP.DYN.CBRT.IN?format=json.
*For EU rate --> https://api.worldbank.org/v2/country/EUU/indicator/SP.DYN.CBRT.IN?format=json.
*For Japan birth rate --> https://api.worldbank.org/v2/country/JPN/indicator/SP.DYN.CBRT.IN?format=json.
The idea here is comparing the evolution of video games popularity against the birth rate during same period of time.
**merge global with global birth rate per 1000 capita
The following is a correlation between video game sales and birth rate per 1000 capita globally.
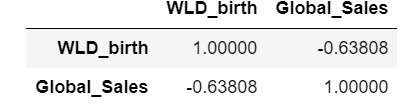
From correlating video game sales to birth rates we can identify a strong correlation between both indicators.

From looking at the correlation charts mentioned above, we can identify a certain trend between the drop of birth rate and rise of video games sales, However, this might be only a lucky coincidence. More data should be collected and analysed in order to establish a causality link.
