This project was carried to complete the Google Data Analytics Certification on Coursera.
- How do annual members and casual riders use Cyclistic bikes differently?
- Why would casual riders buy Cyclistic annual memberships?
- How can Cyclistic use digital media to influence casual riders to become members?
- Lily Moreno, the director of marketing and (supposedly) the manager, who is responsible for the development of campaigns and initiatives to promote bike-sharing program.
- Cyclistic marketing analytics team, who are responsible for collecting, analyzing, and reporting data that helps guide the Cyclistic marketing strategy.
- Cyclistic executive team, who will decide whether to approve the recommended marketing program.
- A stakeholder believes that maximizing the number of annual members will be key to future growth. Therefore, converting casual riders into annual members is the priority here.
- The data analyst should design marketing strategies aimed at converting casual riders into annual members, preferably using the digital media.
- The data source was downloaded from here.
- The data is analyzed using R with packages: tidyverse, janitor, and lubridate.
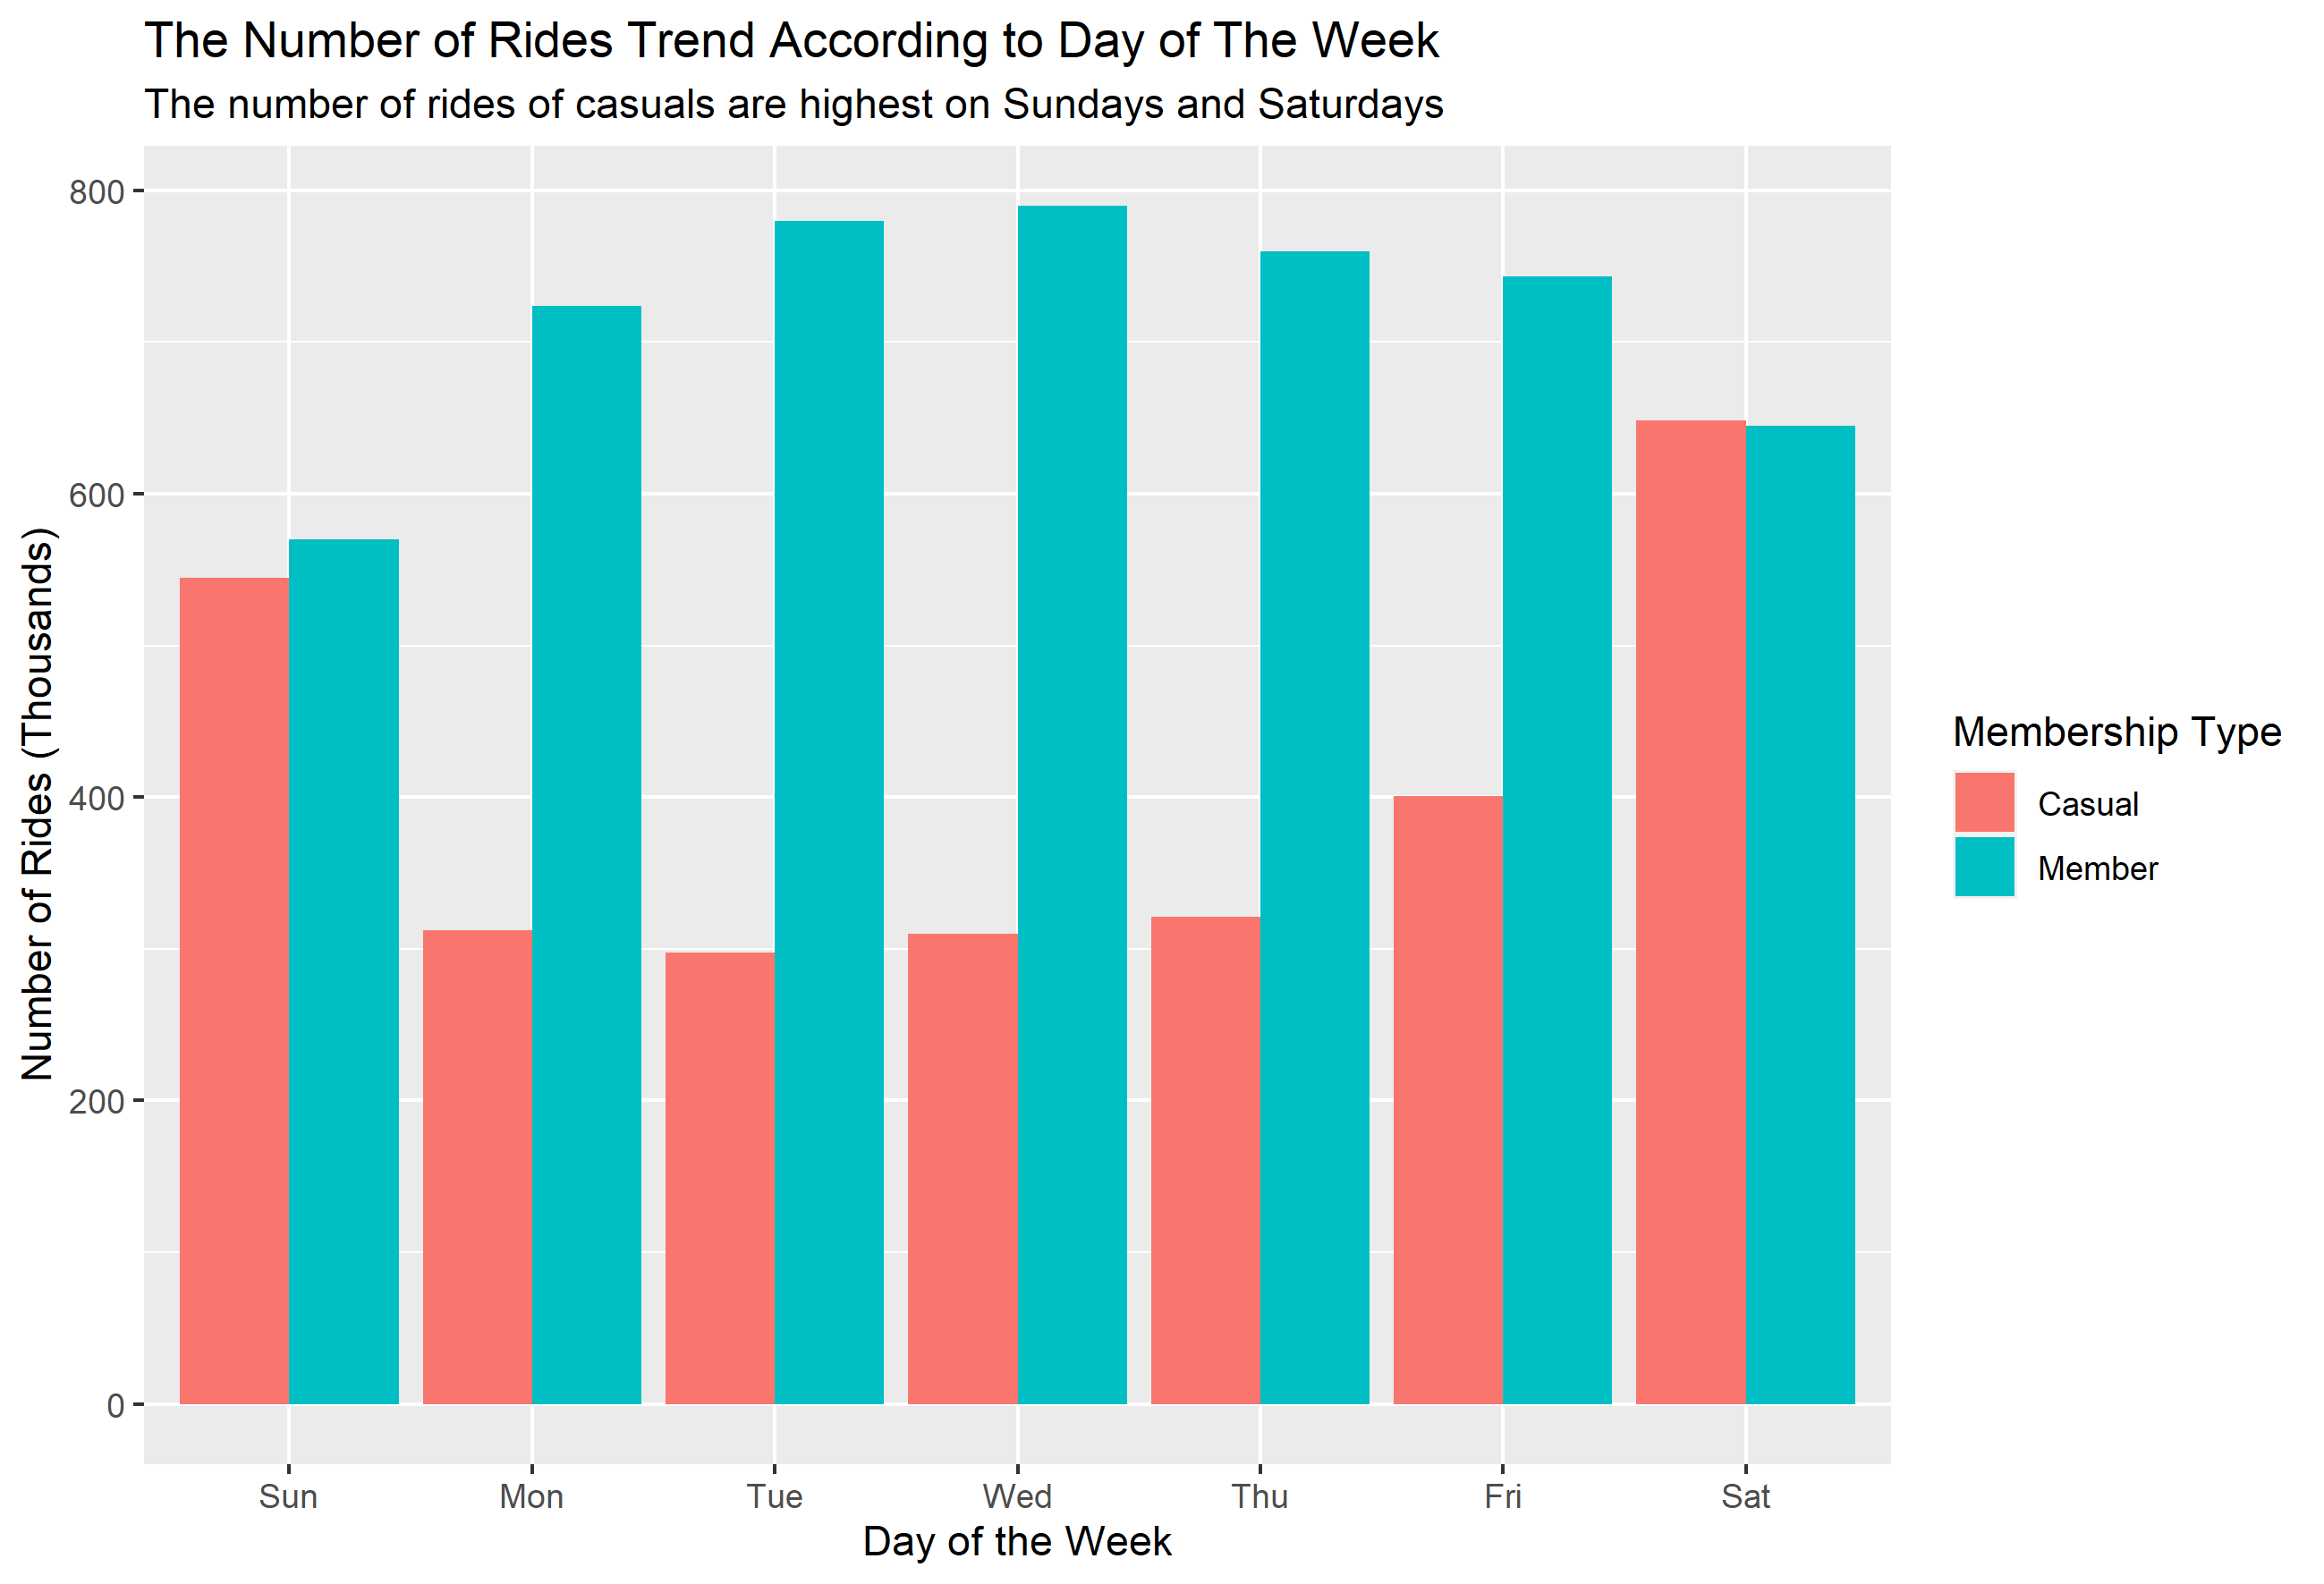


From the visualizations above, it can be observed that:
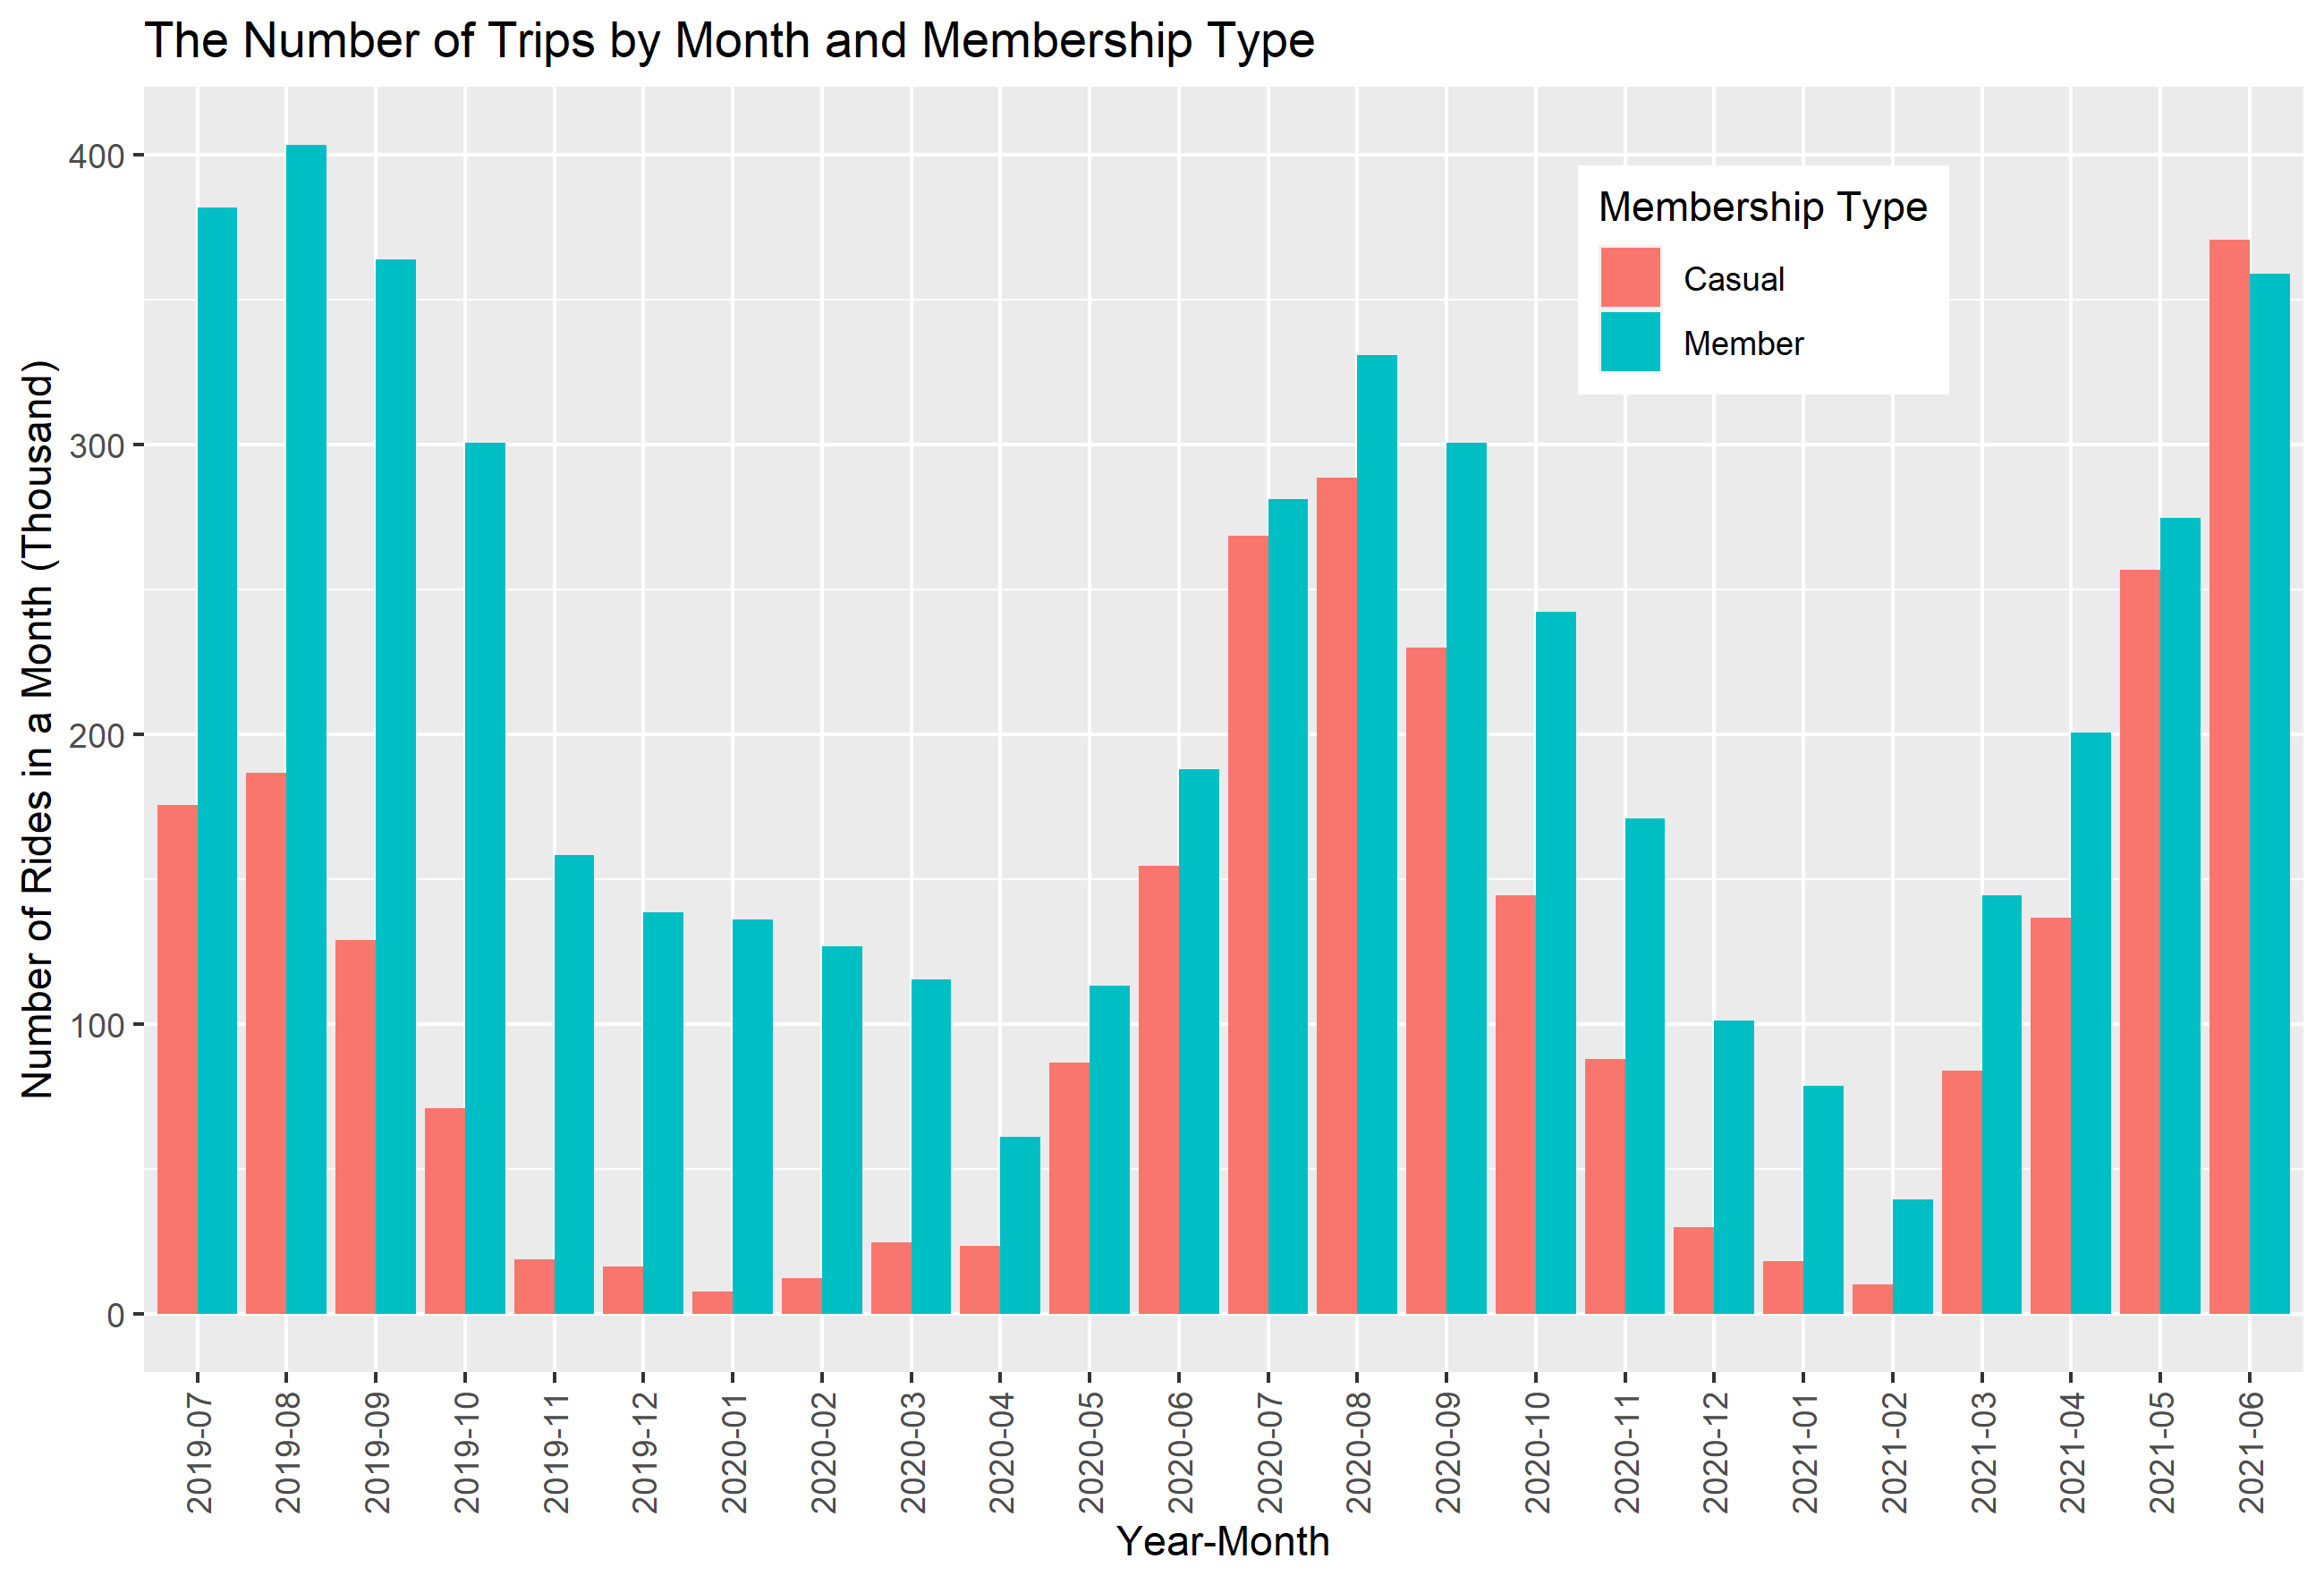
- The number of trips done by casuals tend to lower on weekdays and higher on weekends. This might suggest that members paid annual membership because they use the bike for work.
- The number of trips done by casuals on weekdays are around half of those done by members. This might suggest that a proportion of casuals don't really need the bike for work on weekdays. That's probably why they prefer casual membership.
- The number of trips done by casuals on weekdays are almost the same as those done by members on weekends. This might suggest that casuals use bike for recreational purpose over trip to work.
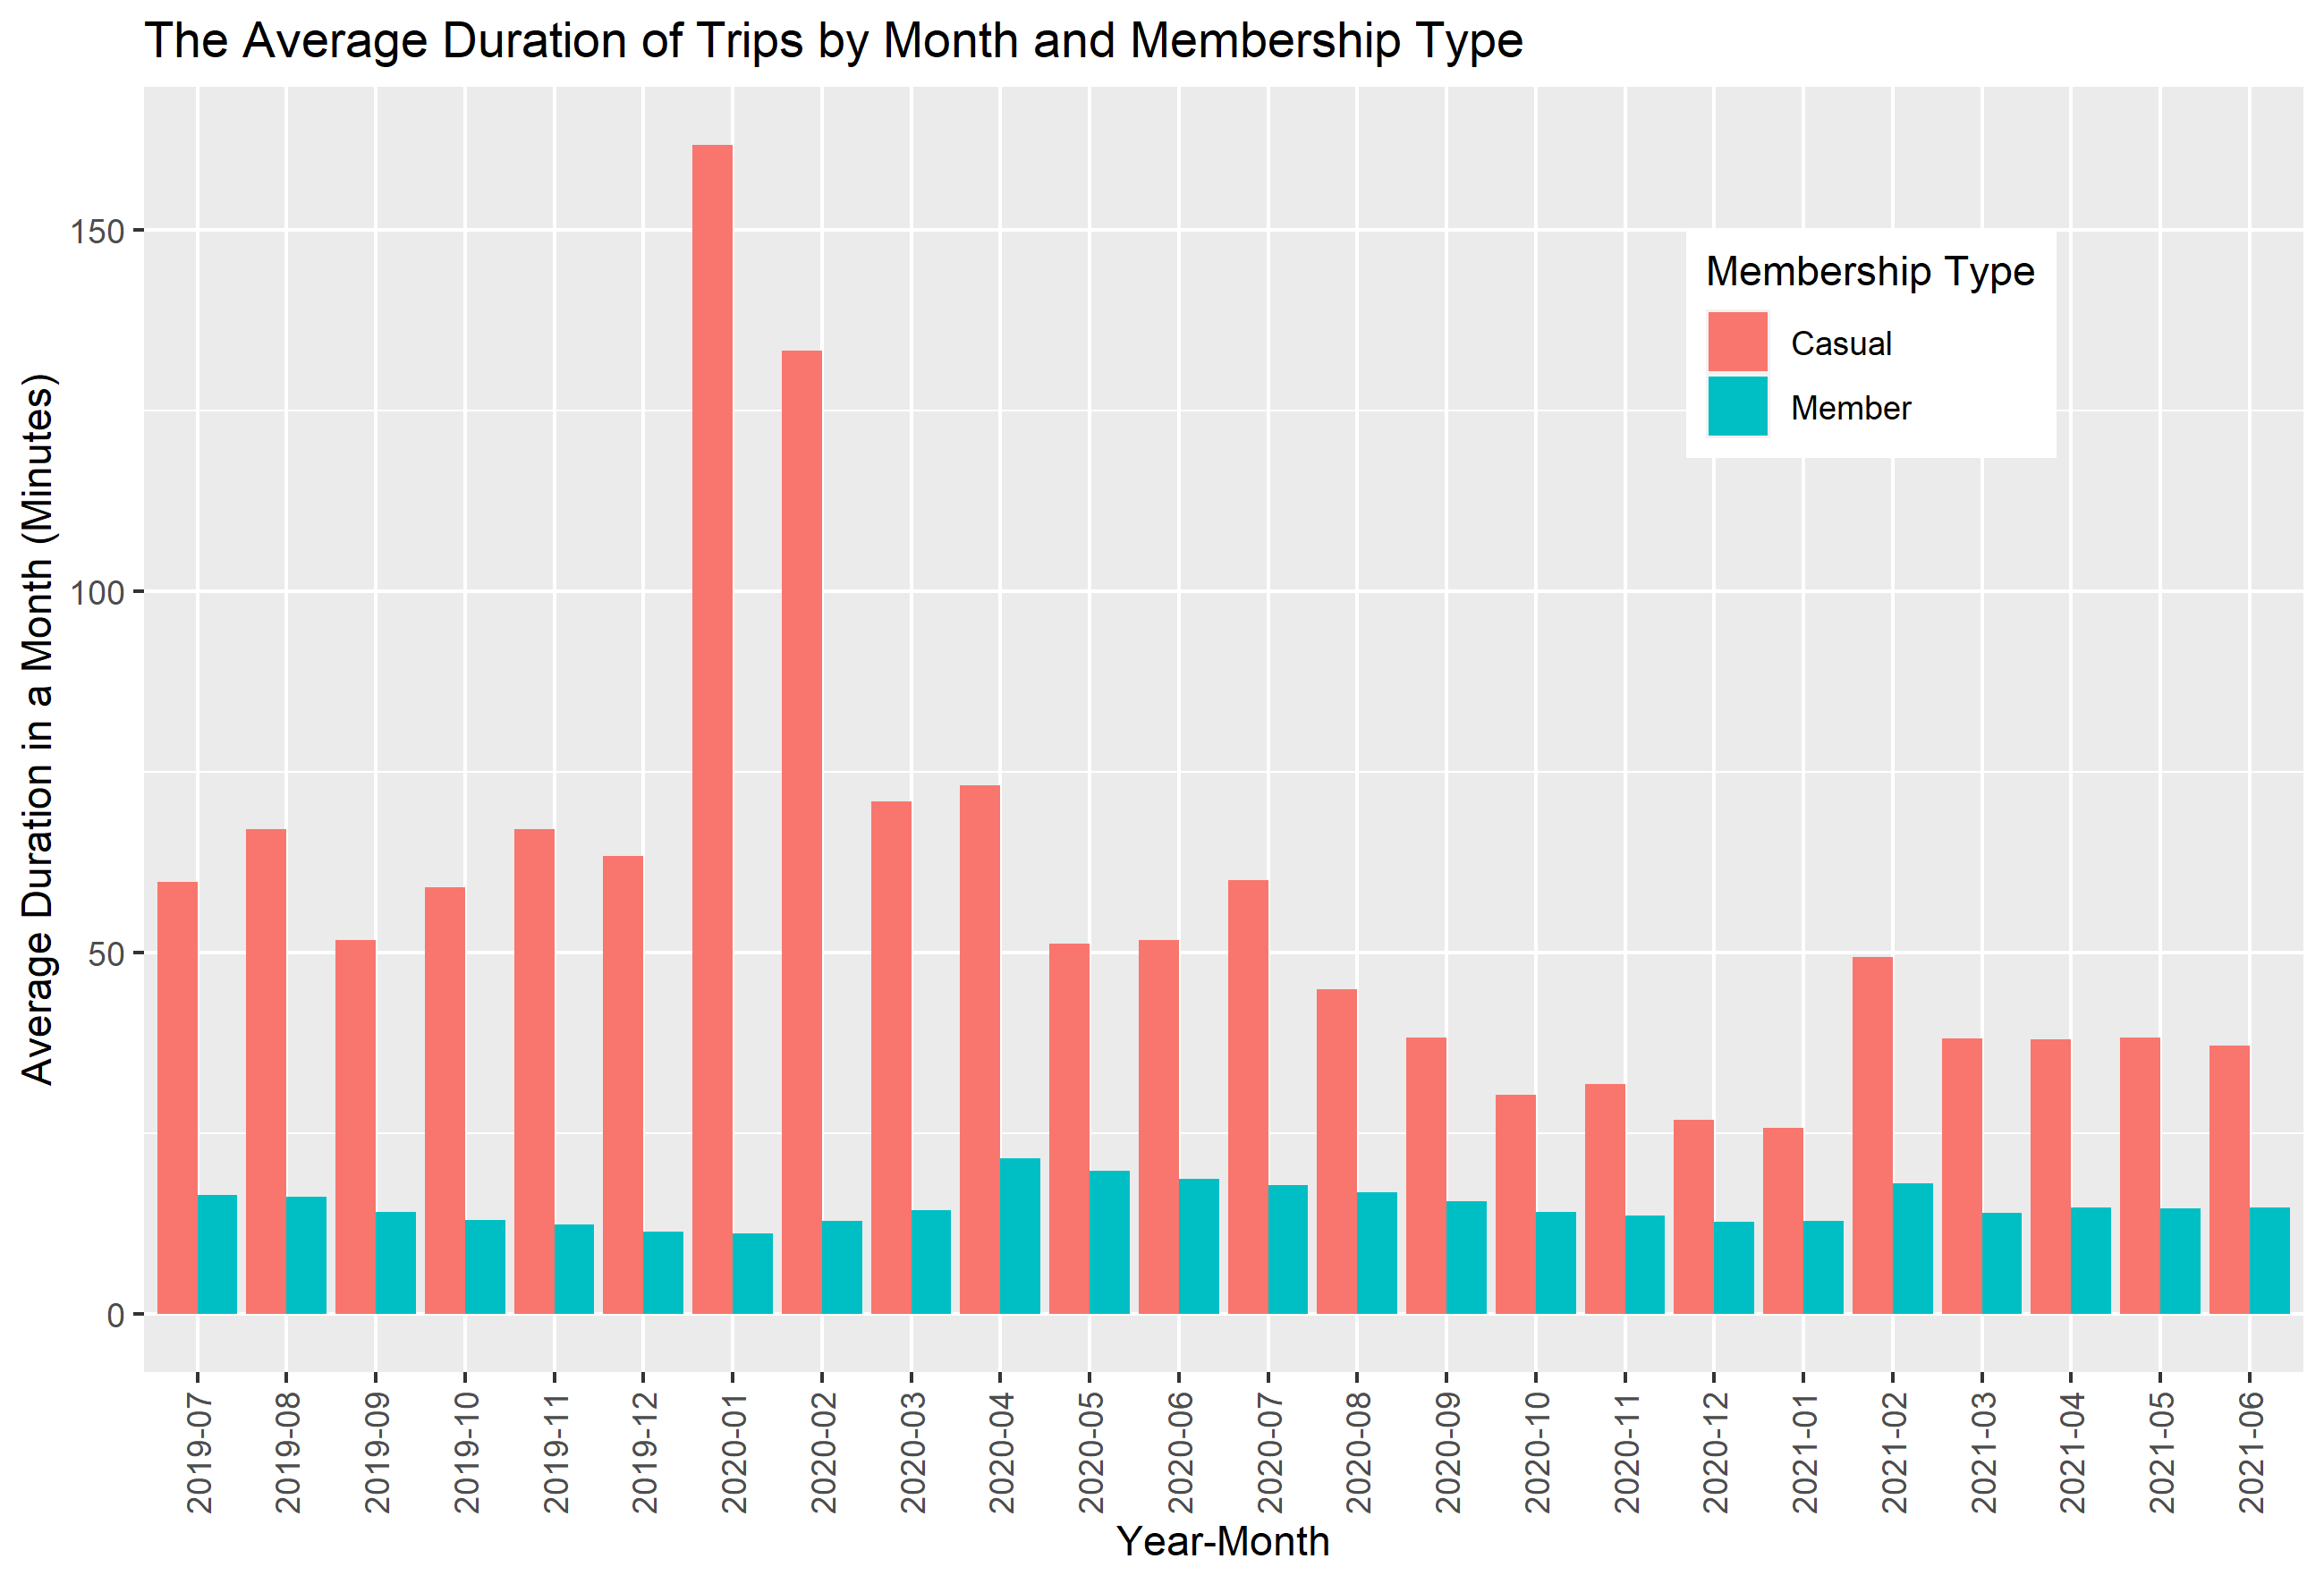
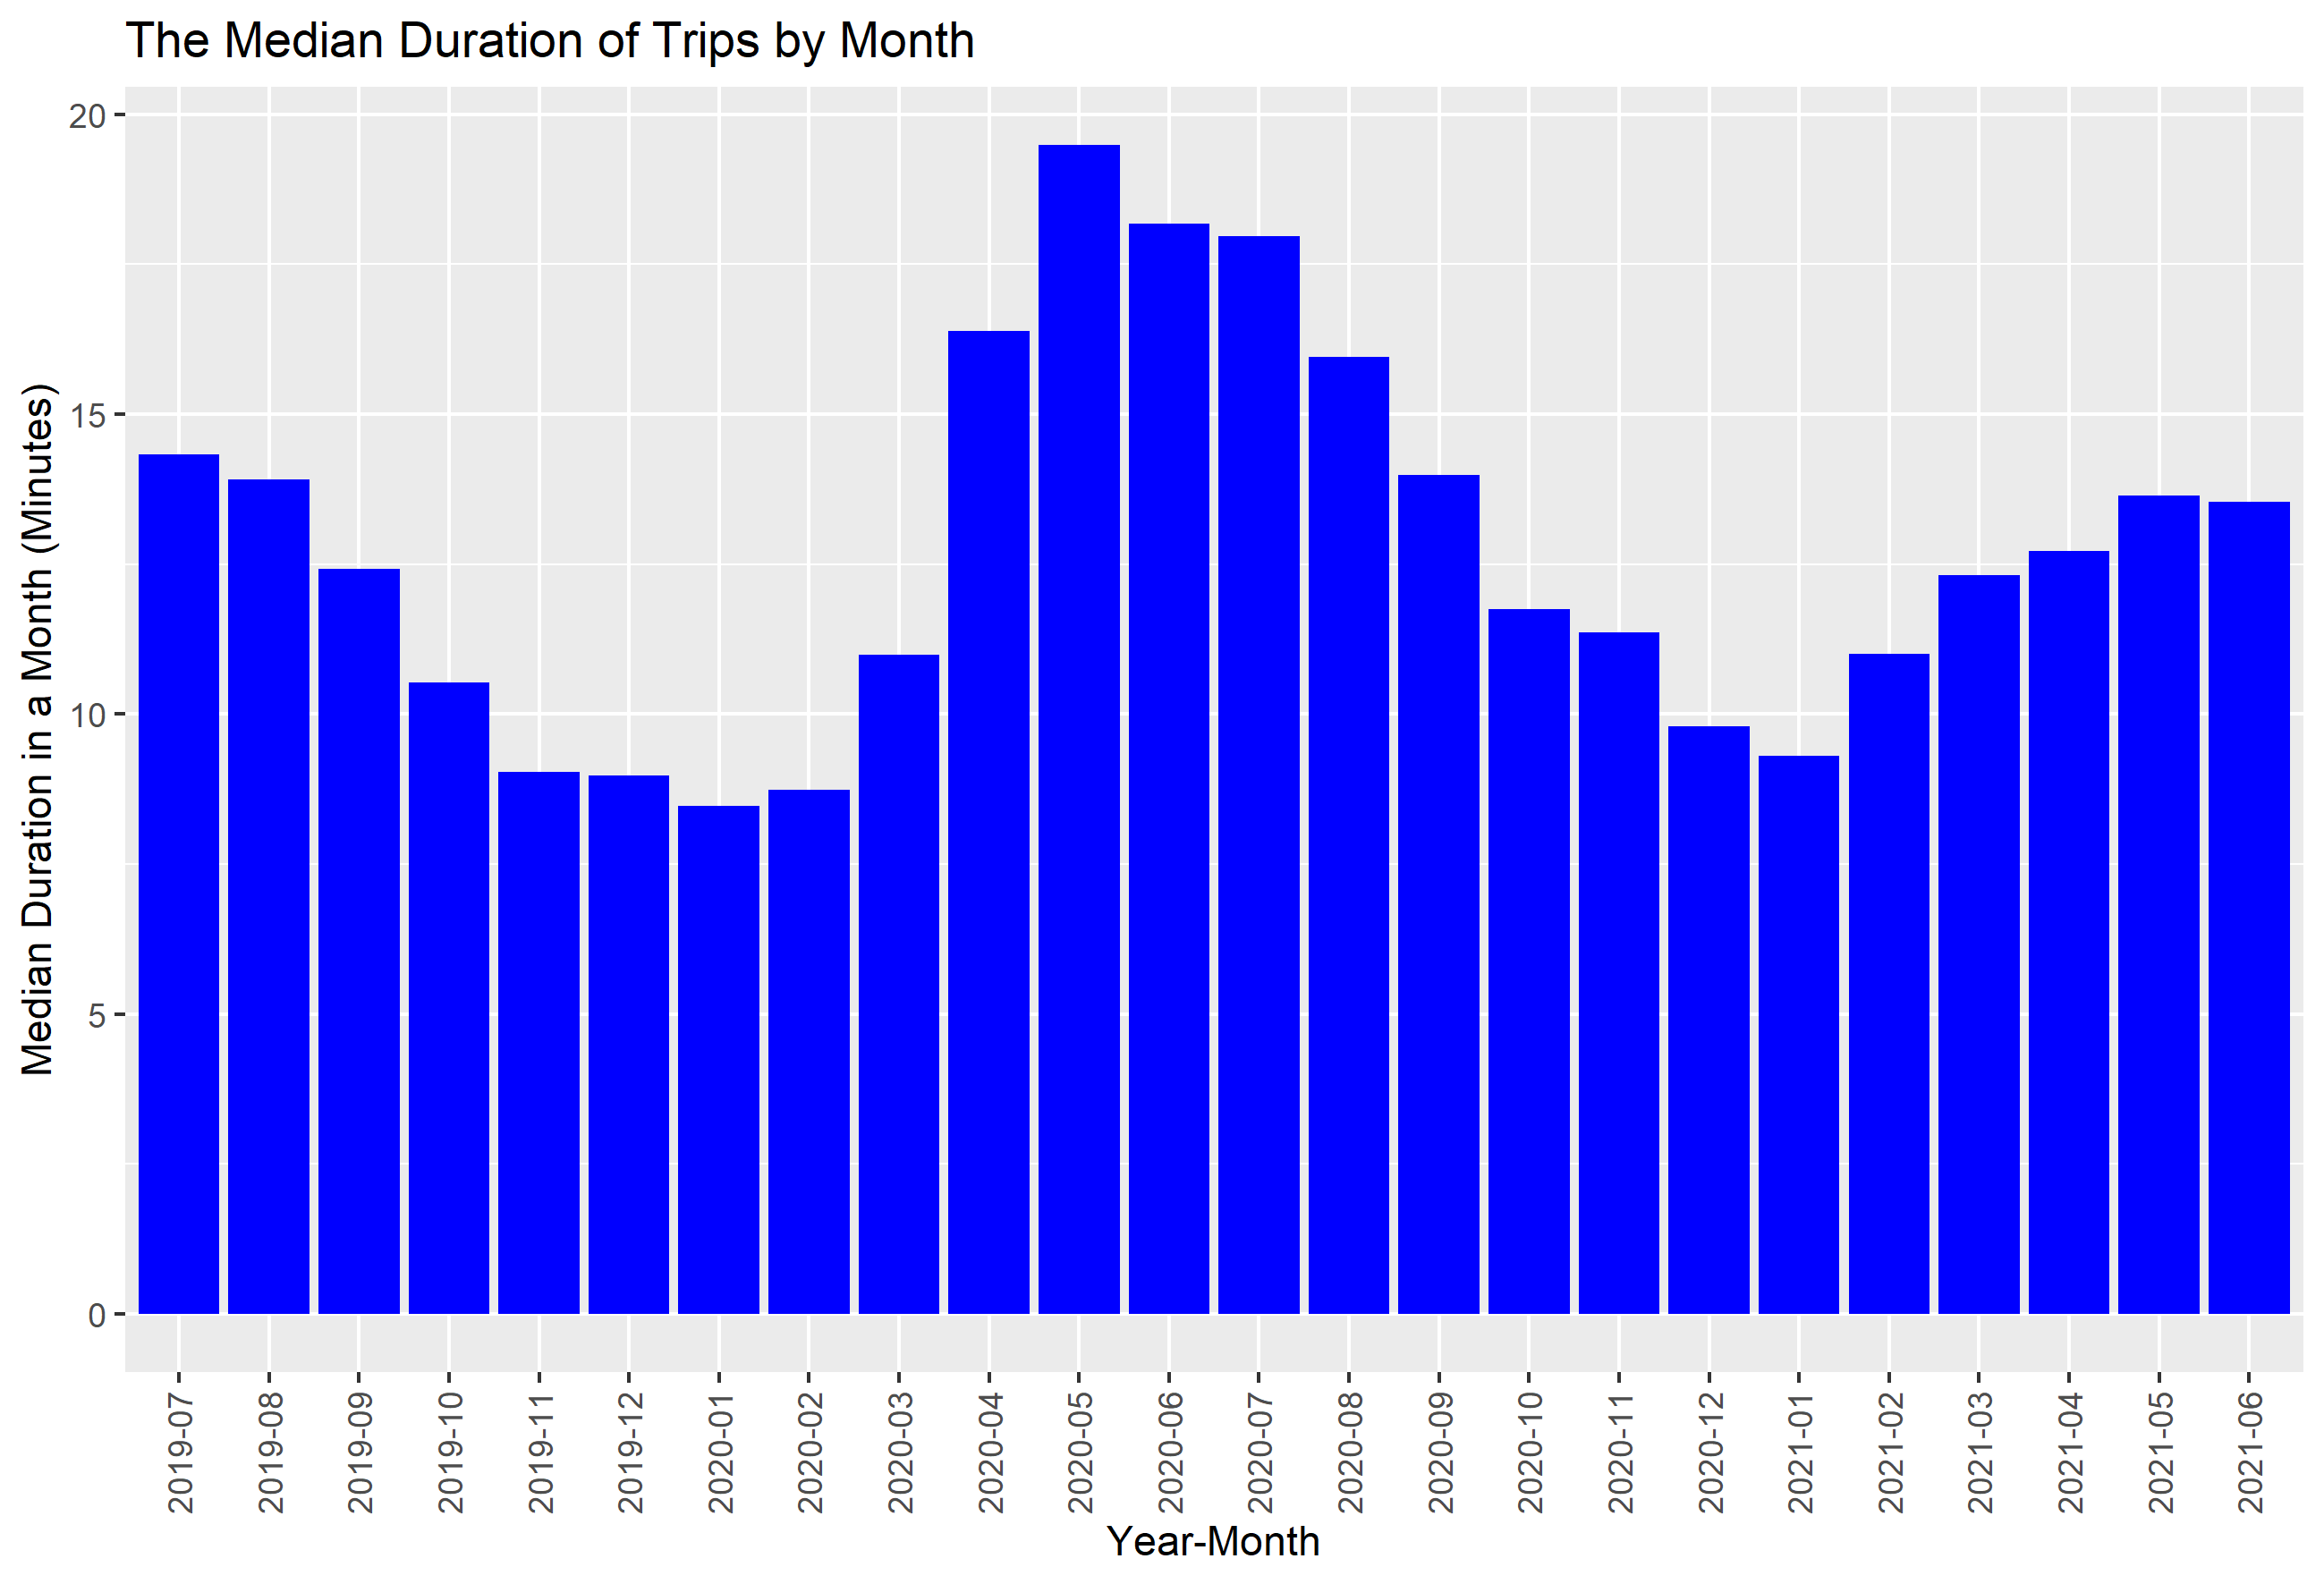
- The average trip duration by casuals by day are around three times as much as those done by members.
- Saturday and Sunday are the most popular day for bike riding for members since the average trip duration tend to get higher on these two days.
- On the other hand, Saturday is the most popular day for bike riding for casuals since the average trip duration is peaked on Saturday.
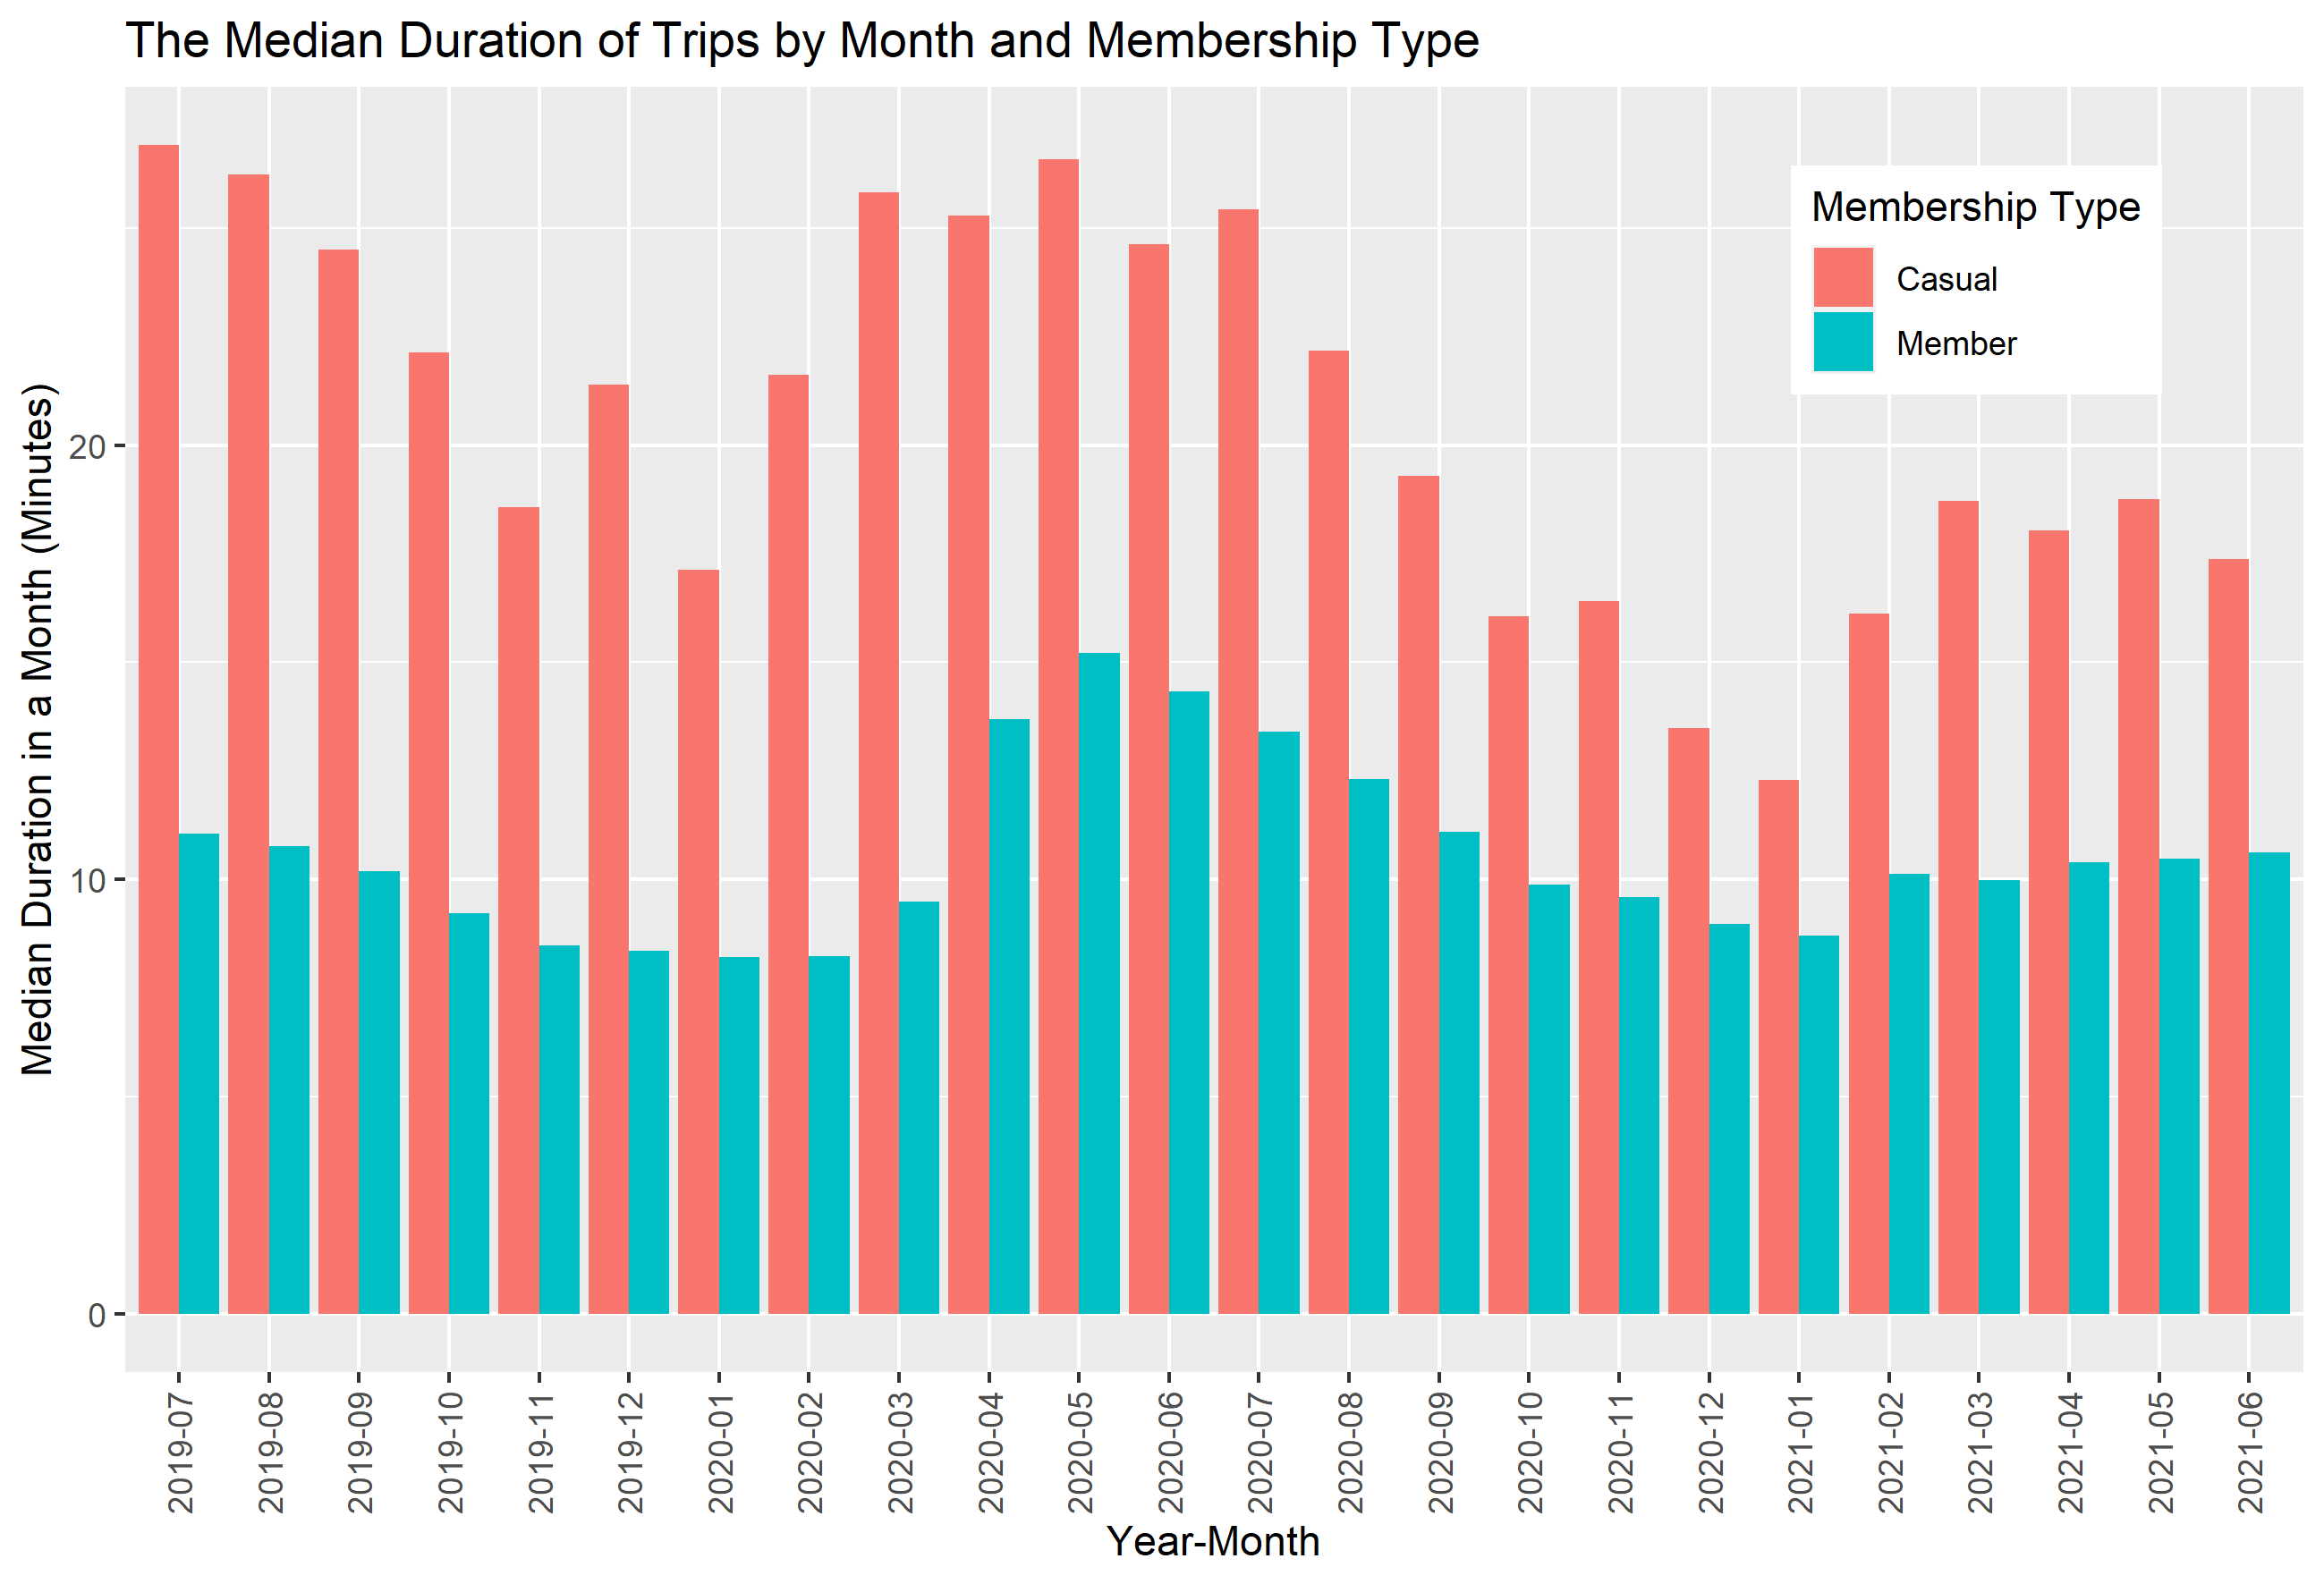
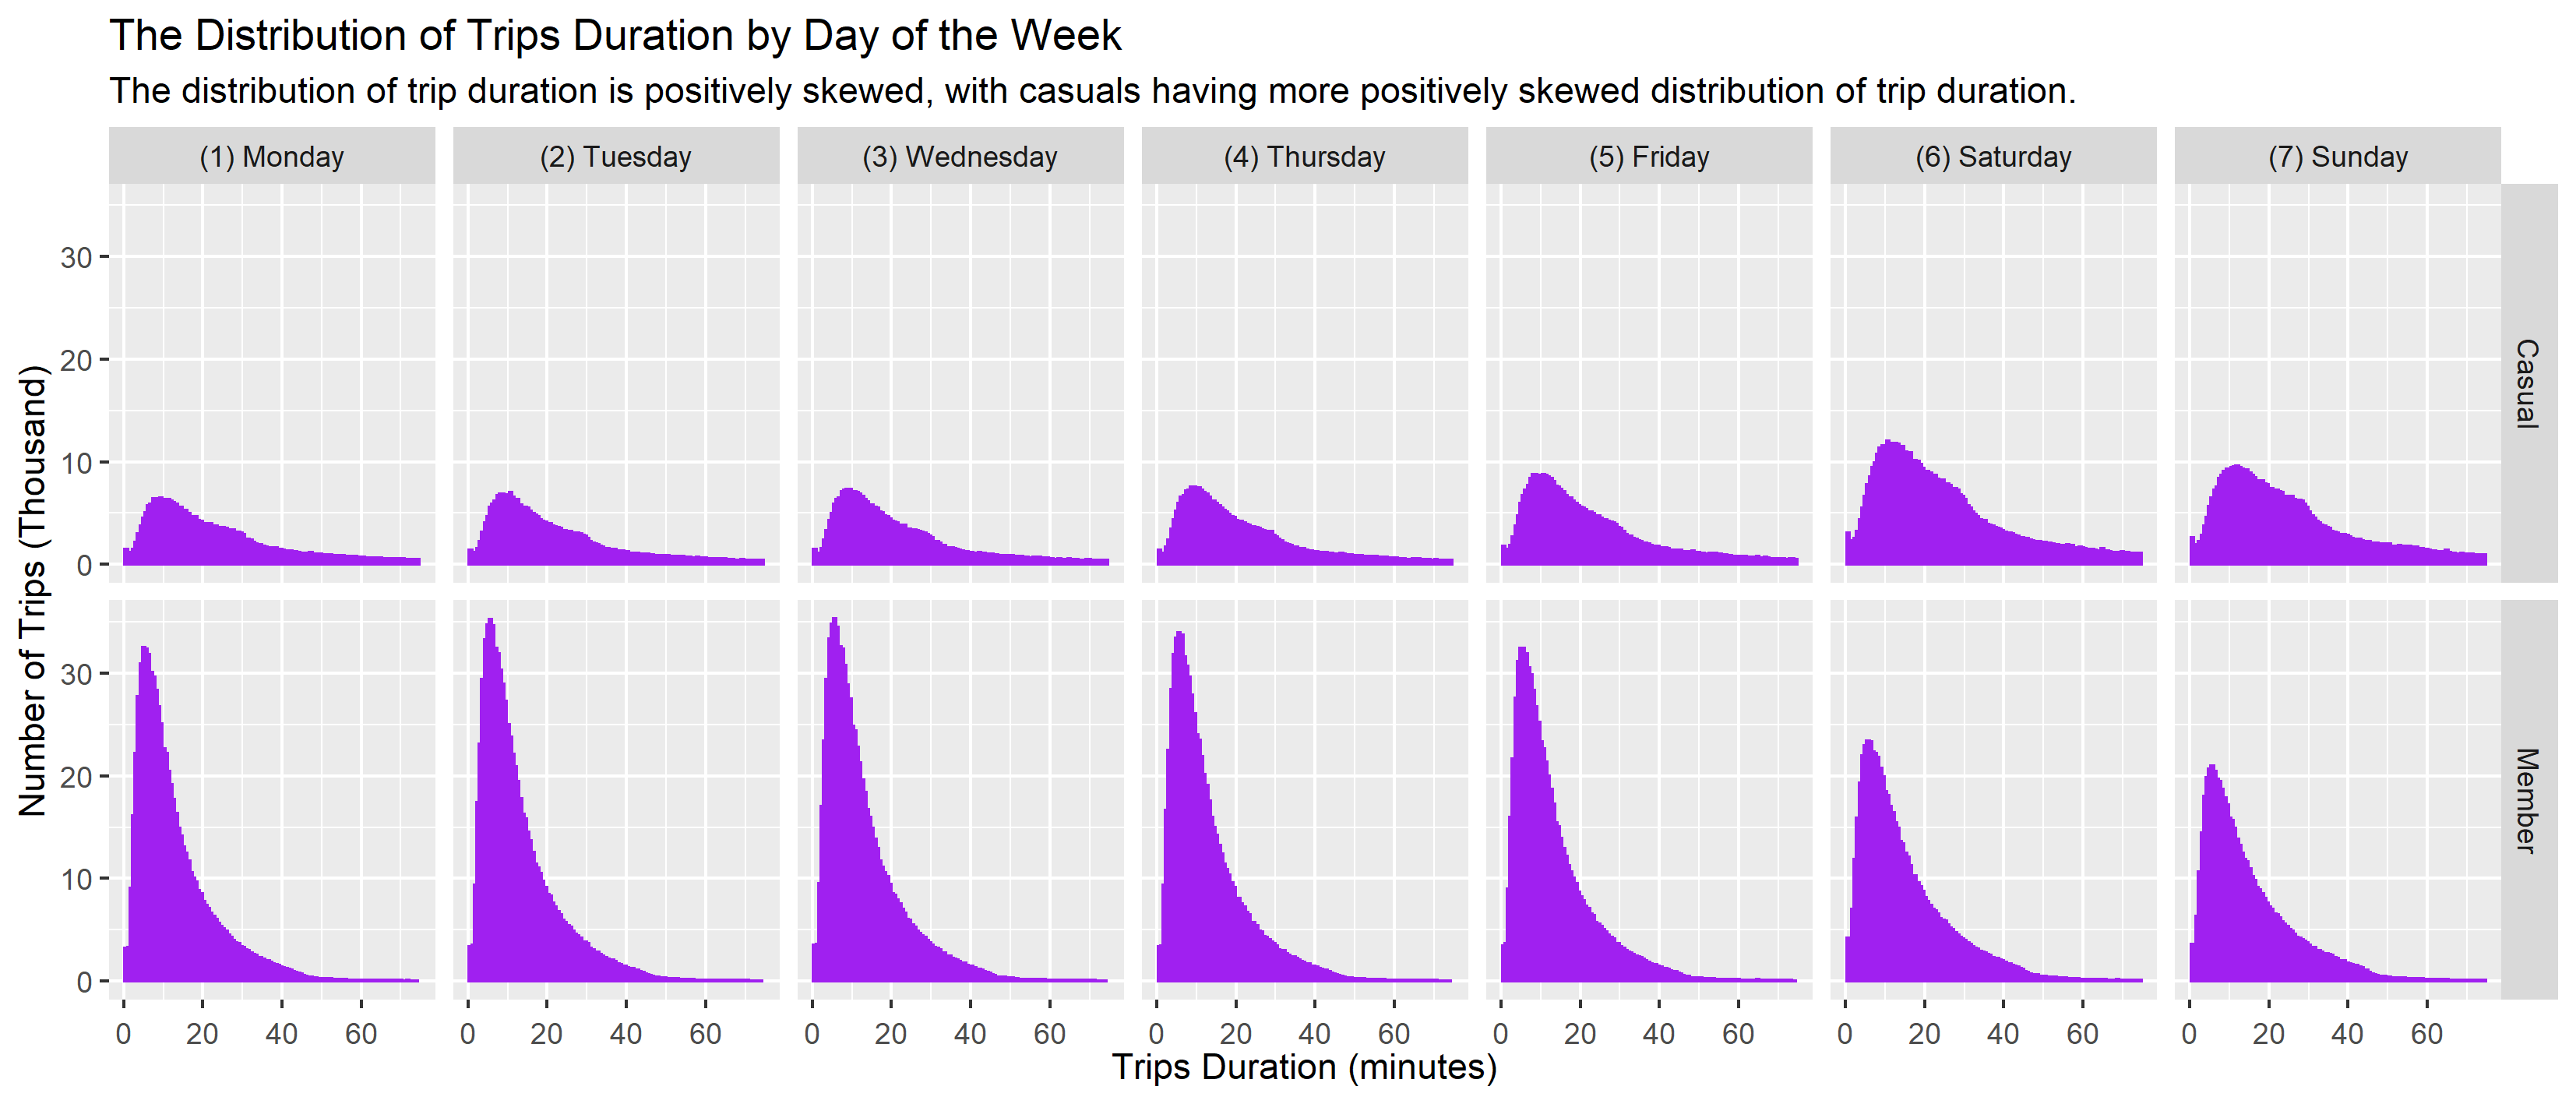
- From the histogram, it's clear that the majority of members only use the bike for less than 20 minutes. Meanwhile, the histogram of trip length for casuals have significantly fatter tail, that is, positively skewed.
Considering the observations above, recommendations to the stakeholders are as follows:
- If the stakeholders are doing ads in person, it is better doing it on weekends and outside winter seasons since the trip number from casuals on weekends and outside winter seasons are almost as high as those of members.
- If the stakeholders want to get as much casuals to convert into members as possible, they might consider offering membership of bike use on weekends only with different (slightly lower) pricing from regular annual membership.
- If the stakeholders want to get as much casuals to convert into members as possible, they might also consider limit the duration of bike use for single-ride pass, say, for the first 30 minutes (1800 seconds), and charging additional fee for trip more than 30 minutes, while not limiting the duration for members. This should push the casuals to consider full-day passes, since the average trip duration of casuals are around 2500 seconds (42 minutes). To convert full-day passes further into annual membership, the stakeholder might want to consider different (higher) pricing on full-day passes on weekends.
- Although the task only requires me to provide 3 recommendation, if possible I would like to add one recommendation regarding the use of digital data. To understand the behaviors of the riders, the stakeholders might want to require the riders to install a mobile phone app by which Cyclistic can notify the users about any promotion or advertisements. The stakeholders might also want to install GPS trackers on the bikes to understand the riders better. I don't know whether the company has implemented this, but if not it might be useful to consider if it's not a violation of privacy. Also, the stakeholders might want to conduct marketing using social media, such as free-ride for users who post winning photo (uploaded in the users’ social media account) taken in various spots in the city. This will let the stakeholders identify which spots are better for marketing purpose.
It would be more interesting if I have the more completed data in order to:
- Distinguish single-ride passes from full-day passes in the datasets
- Observe how much the rider had to pay for every ride in the past into the datasets
- Add the riding data geolocation to understand the users' behaviors better.