PyPI: pip install data-hygiene-auditor
A linter for your data. Point it at a spreadsheet, get back every inconsistency, placeholder, and hidden duplicate — with severity ratings, root causes, and fix code.
pip install data-hygiene-auditor
data-hygiene-audit --input customers.xlsx --output ./reports
Phone numbers stored seven different ways in the same column. "TBD" sitting in a status field for three years. A customer record that looks unique until you notice that whitespace and casing are the only things separating it from four others. These are the issues consultants inherit when they take over someone else's spreadsheet — and the ones nobody finds until they're already in production.
The Data Hygiene Auditor scans Excel, CSV, and TSV files for the specific real-world failure modes that show up in actual consulting engagements: mixed-format inconsistencies, fields used for the wrong purpose, placeholder values that escaped into production, and phantom duplicates hiding behind cosmetic differences.
A single run produces three reports tailored to three audiences: an HTML report for the stakeholder meeting, an Excel findings file for the person doing the cleanup, and a PDF for the deliverable folder.
Mixed Formats — Identifies dates, phone numbers, and currency values stored in inconsistent formats within the same column. For example, 2023-01-15 alongside Jan 15, 2023 and 01/15/2023 in one date field. The auditor recognizes 6 date patterns, 7 phone patterns, and 6 currency patterns.
Misused Fields — Flags data stored in the wrong column: reference codes in name fields, free text in currency columns, invalid email addresses, and mixed boolean representations (Y/N vs 1/0 vs Active/Inactive in the same field).
Placeholder Floods — Detects test values (Test, N/A, TBD, 000-000-0000) that persisted into production, as well as suspiciously repeated values that may indicate defaults that were never updated.
Phantom Duplicates — Finds records that appear different on the surface due to casing, whitespace, or punctuation but represent the same entity after normalization. ID columns are automatically excluded from matching, so two records with different surrogate keys but identical content are still caught.
Fuzzy Duplicates — Goes beyond normalization with fingerprint clustering (catches token reordering like "Smith John" vs "John Smith") and Levenshtein distance matching (catches typos like "Johnathan" vs "Jonathon"). N-gram blocking enables Levenshtein matching on datasets up to 50,000 rows without brute-force overhead. Configurable similarity threshold.
Completeness Baseline — Every field receives a null/missing analysis with severity rating, including detection of whitespace-only values that look populated but carry no data.
Health Score — Every sheet and the overall file receive a 0-100 hygiene score. 90+ is clean, 70-89 needs attention, below 70 has significant issues. The score appears in all three reports and on the CLI.
Fix Suggestions — Every finding includes a copyable pandas code snippet: date normalization scripts, phone reformatting, placeholder replacement, dedup strategies. The HTML report has one-click copy buttons; the Excel report adds a "Suggested Fix" column.
- Automatic field classification. Each column is inferred as one of: date, phone, currency, email, ID, name, categorical, freetext, or zipcode. The correct validation rules are applied based on the inferred type — date-format checks don't run against phone fields, and vice versa.
- Severity ratings on every finding. High, Medium, and Low thresholds are calibrated to the issue type (e.g., >30% format inconsistency = High; 10–30% = Medium).
- Plain-English impact statements. Every finding includes a "Why this matters" explanation written for non-technical stakeholders who need to understand the business consequence, not just the statistic.
- Multi-sheet support. All sheets in a workbook are audited independently.
A single run produces three files:
| Output | Use Case |
|---|---|
*_audit_report.html |
Visual walkthrough with severity badges, format distribution tables, null-completeness bars, and impact explanations. Designed to present to a client or stakeholder. |
*_audit_findings.xlsx |
One row per issue. Frozen header, auto-filter, severity color-coding. Built for the person who needs to work through the fixes. |
*_audit_report.pdf |
Same substance as the HTML in a format suitable for email attachments and formal deliverables. |
Real outputs from a real run are committed to this repo so you can preview them without installing anything. They were produced from the deliberately-messy demo file under samples/ — a 30-row, 2-sheet workbook that exercises every detection category. The run reported 59 issues (23 High, 20 Medium, 16 Low).
| File | Description |
|---|---|
| samples/input/sample_messy_data.xlsx | Input — the messy workbook |
| samples/output/sample_messy_data_audit_report.html | HTML stakeholder report |
| samples/output/sample_messy_data_audit_findings.xlsx | Excel findings file |
| samples/output/sample_messy_data_audit_report.pdf | PDF deliverable |
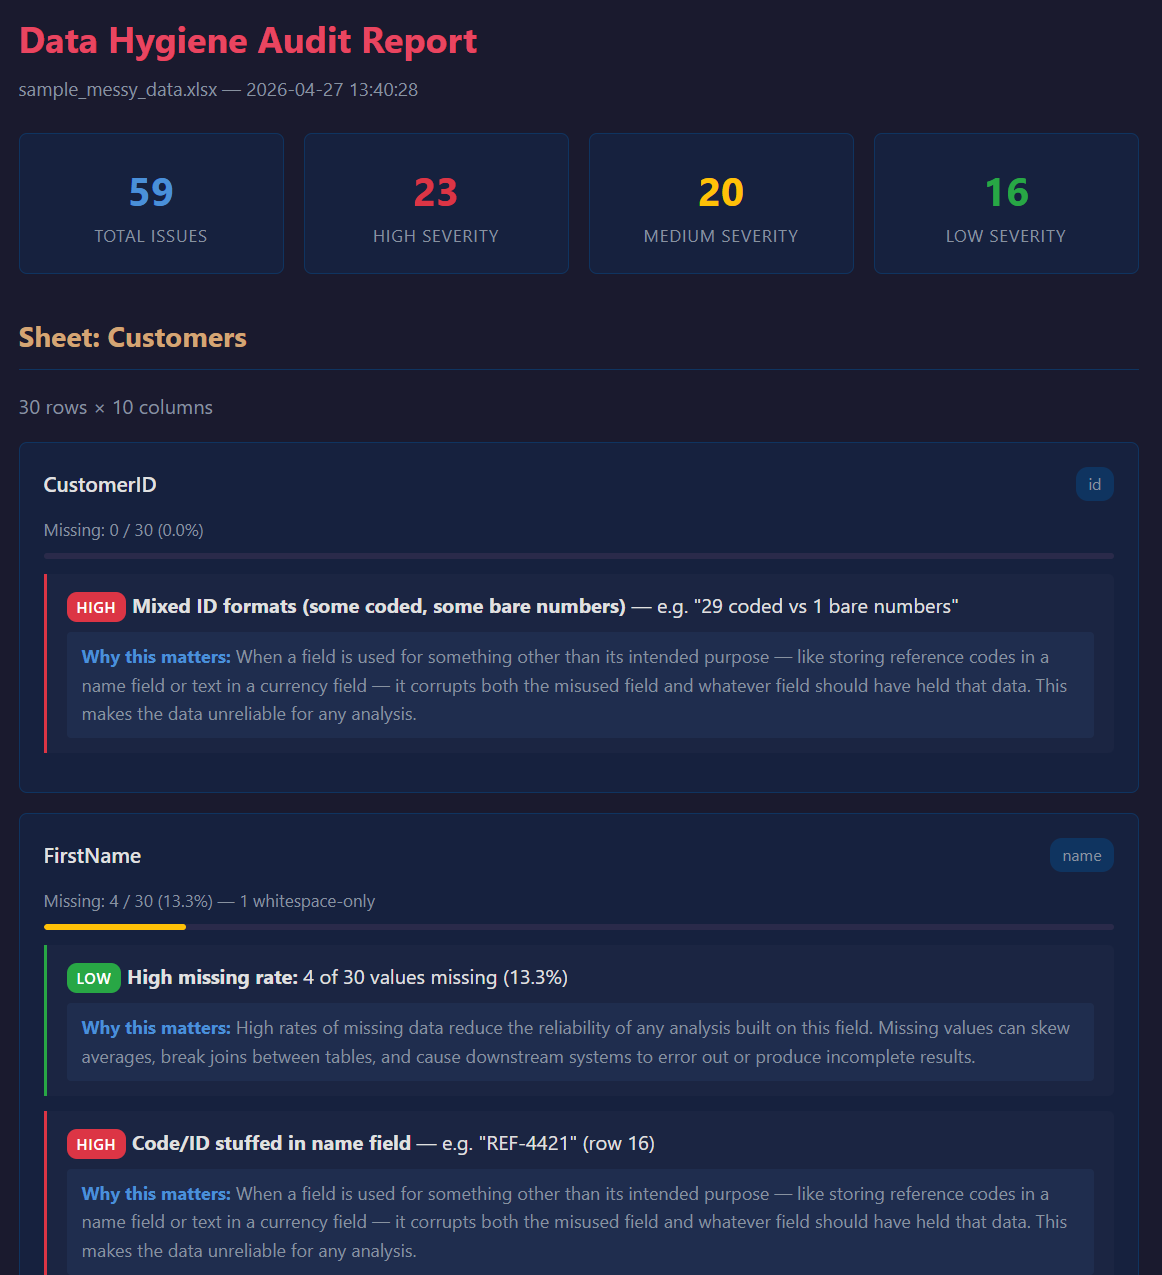
Top of the HTML report. The four cards show total issue count and a breakdown by severity, generated from a 30-row, 2-sheet sample workbook designed to exercise every detection category. Below the summary, findings are organized by sheet and by column.
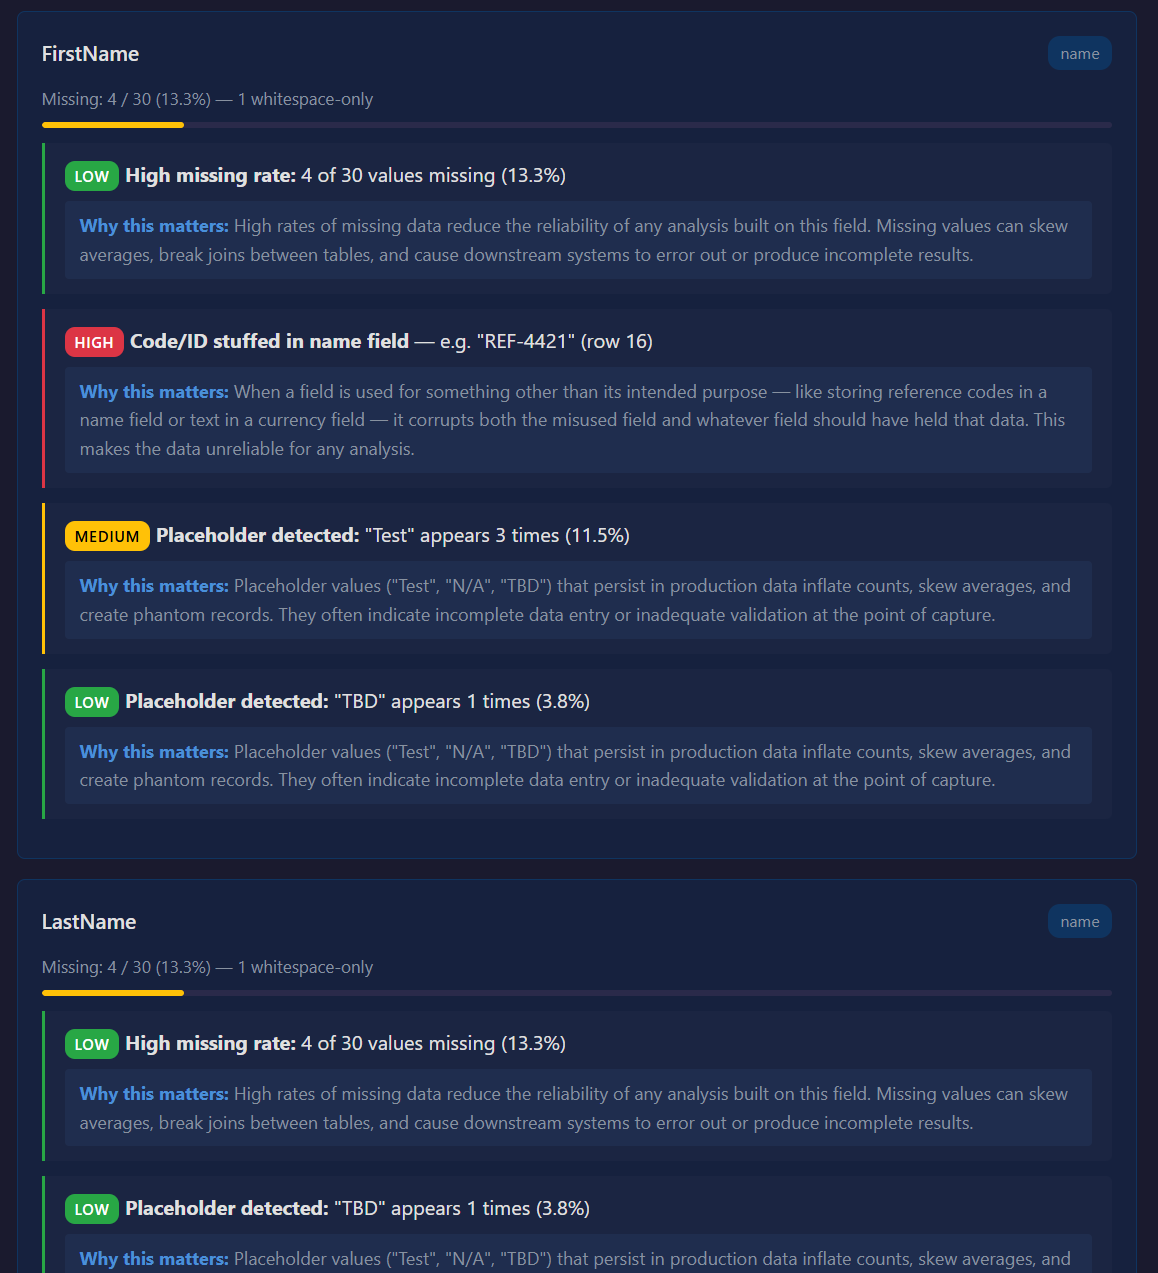
One column (FirstName) with multiple stacked issues at different severities. The yellow progress bar shows the missing-data rate (13.3%, with 1 whitespace-only value), and four findings are stacked underneath: a LOW high-missing-rate flag, a HIGH "code stuffed in name field" flag with a concrete example from row 16, a MEDIUM placeholder detection for "Test", and a LOW placeholder detection for "TBD".
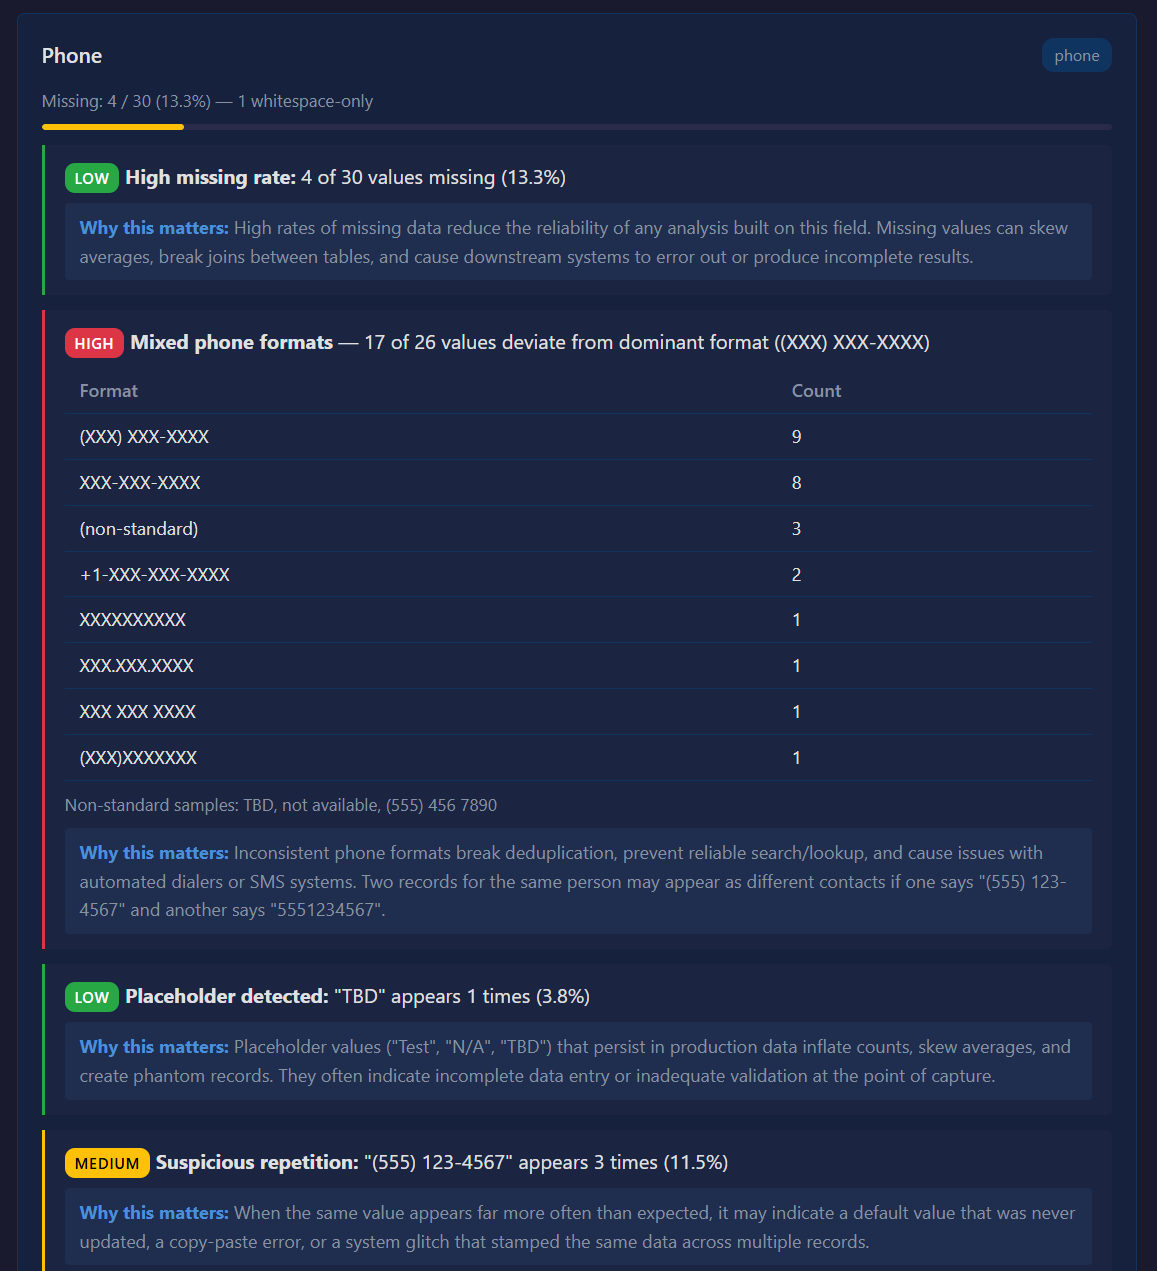
The Phone column finding showing a HIGH severity Mixed Phone Formats issue: 17 of 26 values deviate from the dominant format. The embedded table breaks down the actual format distribution found in the data, so a reader can see exactly which variants are present and how often. Below it, additional findings on the same column flag a placeholder ("TBD") and a suspicious repetition ("(555) 123-4567" appearing 3 times).
To regenerate the outputs locally:
python audit.py --input samples/input/sample_messy_data.xlsx --output samples/output/
pip install data-hygiene-auditor
Or install from source:
pip install .
data-hygiene-audit --input <file> --output <report_directory>
Or run directly:
python audit.py --input <file> --output <report_directory>
Supports .xlsx, .xls, .csv, and .tsv files.
| Flag | Description |
|---|---|
--input, -i |
Path to file, directory, or glob pattern (required) |
--output, -o |
Directory for generated reports (required) |
--json |
Also output the raw findings as structured JSON |
--threshold, -t |
Fuzzy duplicate similarity threshold, 0.0–1.0 (default: 0.85) |
--schema, -s |
Path to a schema JSON for type/completeness validation |
--generate-schema |
Infer types from the data and save a schema JSON to the given path |
--baseline, -b |
Path to a previous audit JSON for trend comparison (shows deltas) |
--rules, -r |
Path to custom rules JSON for additional checks |
--sarif |
Output findings in SARIF format (for GitHub Code Scanning) |
--export-fixes |
Export remediation plan as CSV (sorted by severity, with fix code) |
--fail-under |
Exit with code 1 if health score is below this threshold (0-100) |
--quiet, -q |
Suppress all terminal output (just write report files) |
--force |
Process files exceeding the 2M row safety limit |
--version, -V |
Print version and exit |
python audit.py --input samples/input/sample_messy_data.xlsx --output ./reports
  Data Hygiene Auditor
  Auditing: samples/input/sample_messy_data.xlsx

  [1/2] Analyzed sheet: Customers  (score: 42)
  [2/2] Analyzed sheet: Orders  (score: 68)

  Generating reports...
    HTML  -> ./reports/sample_messy_data_audit_report.html
    Excel -> ./reports/sample_messy_data_audit_findings.xlsx
    PDF   -> ./reports/sample_messy_data_audit_report.pdf

  Health Score: 55/100
  59 issues found  —  High: 23 | Medium: 20 | Low: 16
After pip install ., the auditor is importable as a Python library with typed results:
from data_hygiene_auditor import audit_file

result = audit_file("customers.xlsx")
print(f"Health Score: {result.overall_score}/100")

for sheet in result.sheets:
    print(f"\n{sheet.name}: {sheet.health_score}/100")
    for finding in sheet.findings:
        print(f"  [{finding.severity}] {finding.field}: {finding.description}")
        if finding.fix:
            print(f"    Fix: {finding.fix.description}")
The audit_file() function returns an AuditResult with typed access to all findings:
result = audit_file("data.xlsx")

# Filter by severity
critical = result.high_issues
warnings = result.medium_issues

# Access raw dict for custom processing
raw = result.to_dict()

# Generate reports programmatically
result.generate_html("report.html")
result.generate_excel("findings.xlsx")
result.generate_pdf("report.pdf")

# Adjust fuzzy matching sensitivity
strict = audit_file("data.xlsx", fuzzy_threshold=0.95)
loose = audit_file("data.xlsx", fuzzy_threshold=0.70)
Works in Jupyter notebooks — call audit_file() in a cell and explore the typed results interactively.
Define your own detection rules in a JSON file to enforce project-specific data standards alongside the built-in checks.
data-hygiene-audit --input data.xlsx --output ./reports --rules my_rules.json
{
  "rules": [
    {
      "name": "Phone format (US)",
      "description": "Phone numbers should match (XXX) XXX-XXXX format",
      "severity": "High",
      "condition": "regex_match",
      "threshold": "^\\(\\d{3}\\) \\d{3}-\\d{4}$",
      "column_pattern": "phone|tel"
    }
  ]
}
Each rule requires: name, description, severity (High/Medium/Low), condition, and threshold.
"column_pattern": "phone|tel"— regex matched against column names (case-insensitive)"columns": ["Status", "Type"]— explicit list of column names- Omit both to apply the rule to all columns
| Condition | Threshold | Fires when |
|---|---|---|
regex_match |
Regex string | Values don't match the pattern |
not_regex_match |
Regex string | Values match the disallowed pattern |
min_length |
Number | Values are shorter than threshold |
max_length |
Number | Values are longer than threshold |
allowed_values |
Array of strings | Values not in the allowed set (case-insensitive) |
disallowed_values |
Array of strings | Values found in the disallowed set (case-insensitive) |
max_missing_pct |
Number (0-100) | Missing percentage exceeds threshold |
See samples/rules_example.json for a working example with 4 rules.
Pass a directory or glob pattern to audit multiple files at once:
data-hygiene-audit --input ./data/ --output ./reports
data-hygiene-audit --input "exports/*.csv" --output ./reports
Each file gets its own set of reports. The CLI shows a combined health score across all files.
Use --fail-under to gate CI pipelines on data quality:
data-hygiene-audit --input data.xlsx --output ./reports --fail-under 70
Exits with code 1 if the health score drops below the threshold.
- uses: actions/checkout@v4
- uses: actions/setup-python@v5
  with:
    python-version: '3.12'
- uses: ./.github/actions/audit
  with:
    file: data/customers.xlsx
    fail-under: '70'
rules: rules.json- name: Run audit with SARIF
run: |
pip install .
data-hygiene-audit --input data/ --output ./reports --sarif audit.sarif
- uses: github/codeql-action/upload-sarif@v3
with:
sarif_file: audit.sarifFindings appear as code scanning alerts in the GitHub Security tab.
generate_sample.py recreates the deliberately-messy demo workbook at samples/input/sample_messy_data.xlsx. Run it if you want to modify the demo data or verify that generation is reproducible. The committed outputs in samples/output/ can then be regenerated with the command shown in See It In Action.
python generate_sample.py
- Python 3.9+
- pandas
- openpyxl
- reportlab
Maintainer release process: see RELEASING.md
MIT — see LICENSE
Built by Lailara LLC — data hygiene and analytics consulting for specialty food brands scaling into national retail.