
React.js, Tailwind
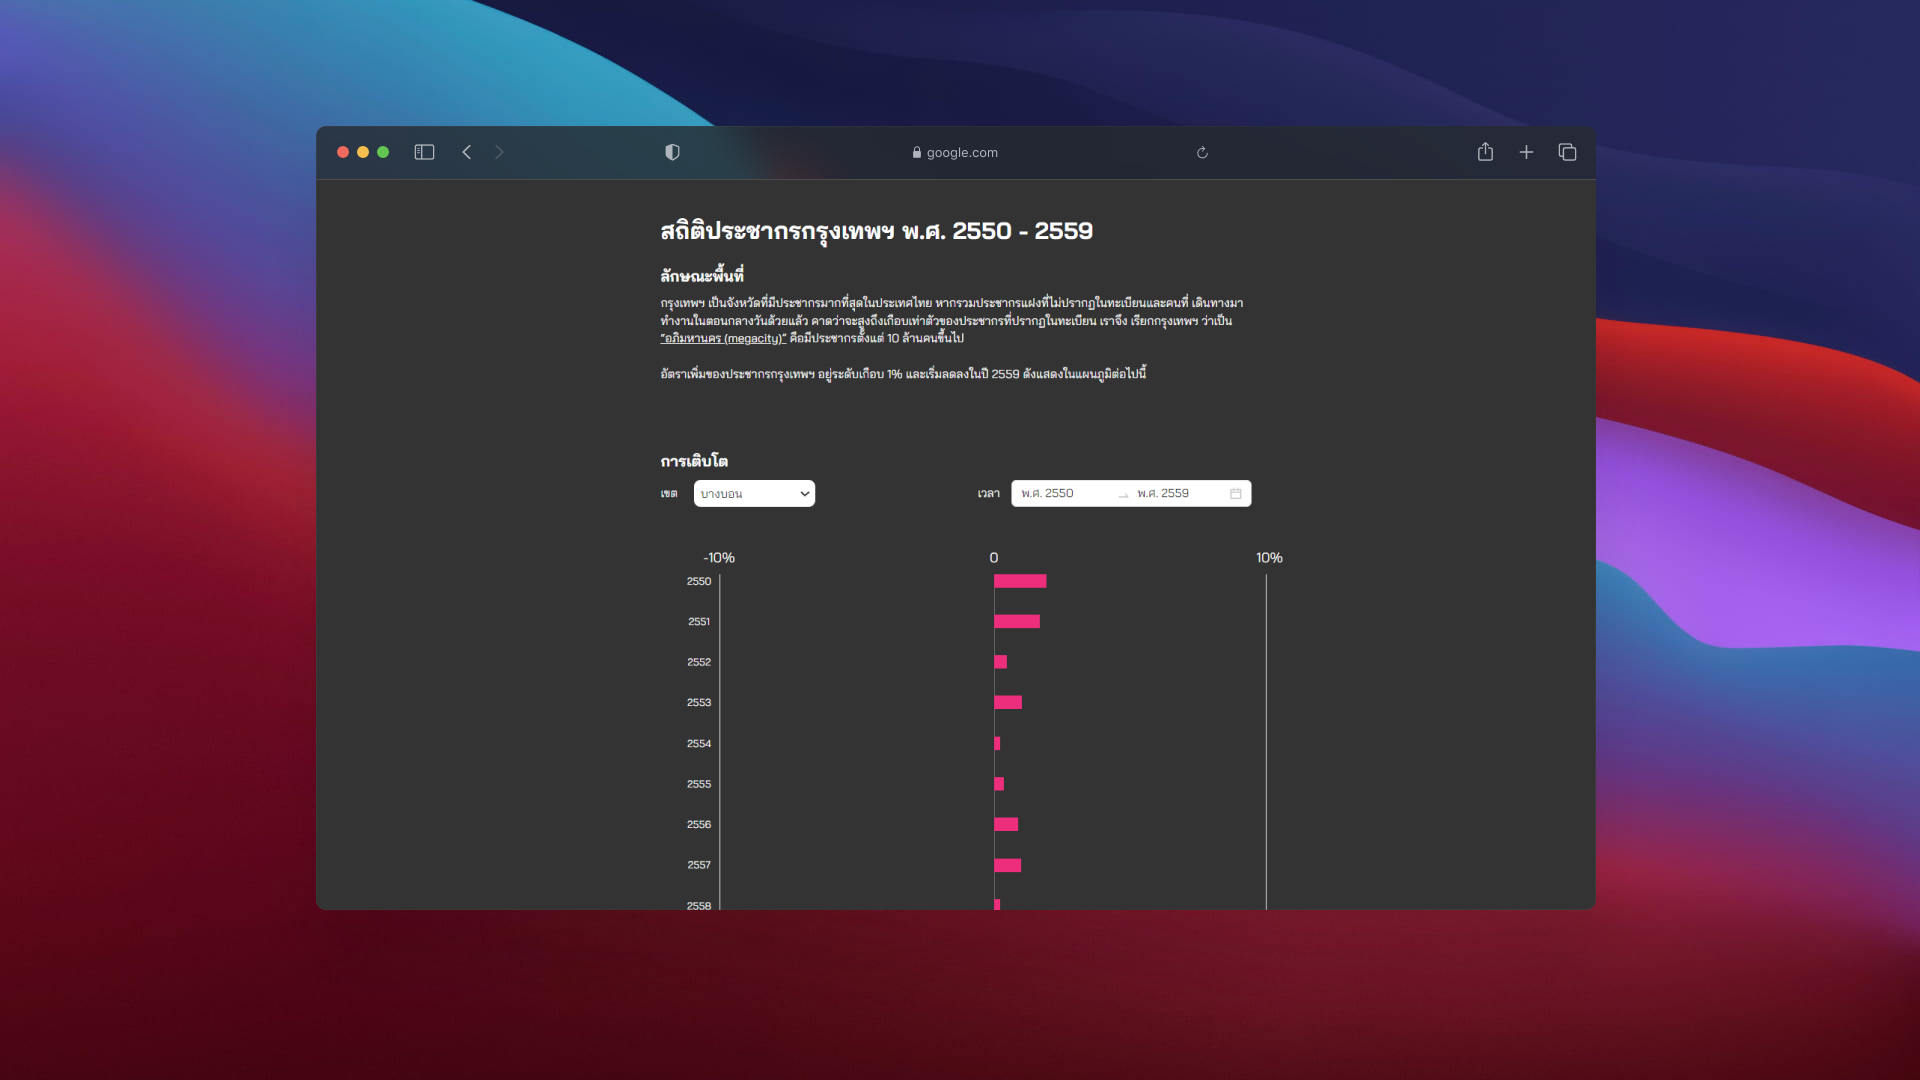
(bar chart on this site use only CSS to calculate the position of the graph)
- User can use dropdown menu to select a district and view population growth in Bangkok.
- User can click link to view reference news.
- Support both desktop and mobile users.
- Ability to filter by year range (now can display current available year)
- Maximum boundary of the bar chart should be displayed depending on the dataset for that district.