Team ME 633 project at Wichita State University, 2016. Documentation refreshed in 2026.
I helped assemble a two-sensor vibration setup as part of a team and contributed discussion and analysis of the recorded response. The system used three LabVIEW channels. The surviving Excel workbook preserves 1,022 recorded samples.
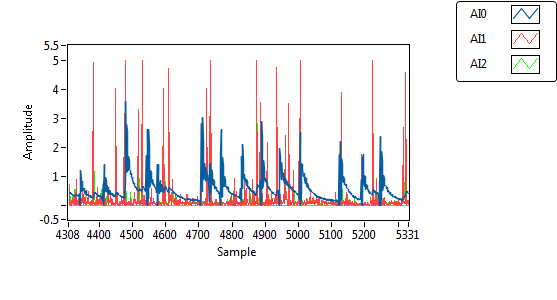
The rig used a Keyestudio KS0037 vibration sensor and a MiniSense 100 piezo element connected through an Arduino Uno.
- AI0 recorded the Keyestudio analog output.
- AI1 recorded the MiniSense output.
- AI2 recorded the Keyestudio digital output.
The three channels provided different views of the sensor response. The discussion compared the recorded responses, differences in sensor sensitivity, and sensitivity adjustment.
The preserved run spans sample numbers 4310 through 5331. The chart below replots the same three channels from the exported readings.
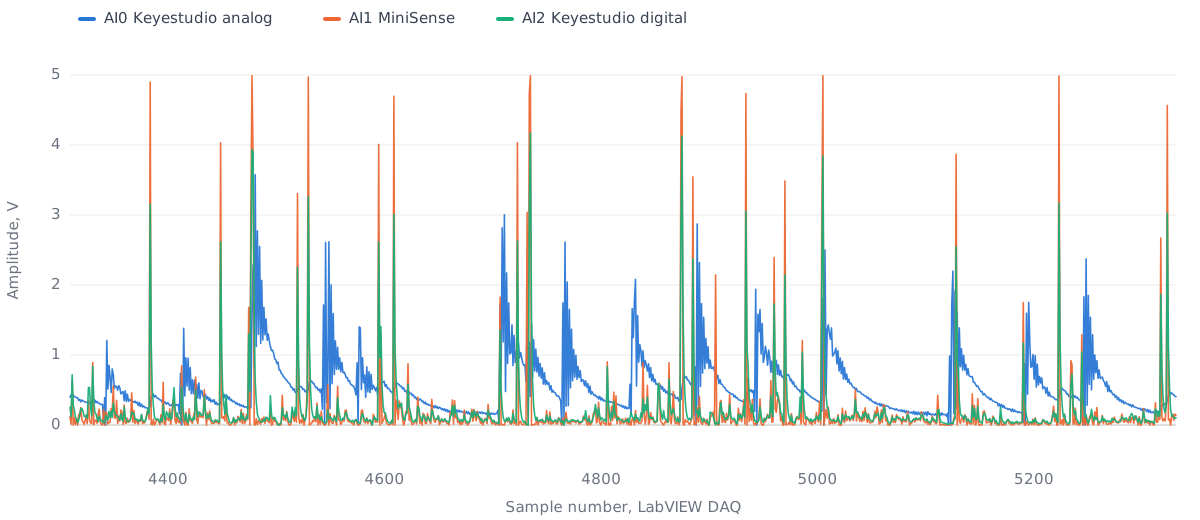
The measured peaks were 3.57 V on AI0, 4.99 V on AI1, and 4.17 V on AI2. These are channel voltages. They do not establish calibrated displacement or acceleration.
The horizontal axis uses sample number. A sample rate is needed to convert it to elapsed time or make a frequency claim.
I participated in assembling the setup with the team. For the report, I contributed discussion and analysis comparing the two sensors' recorded response and sensitivity.

