Extra Analyses
In this extra analysis, I have chosen 2 bins from each samples D1 and D3. While choosing bins, I have considered them to have almost complete taxonomy, and having actual genes expressed in their assembly, i.e. they should not have only hypothetical proteins expressed the most. For that, I have chosen the following bins in order to reconstruct metabolic pathways with STRING:
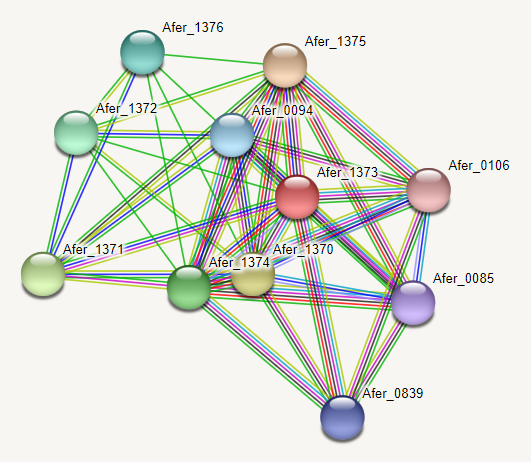
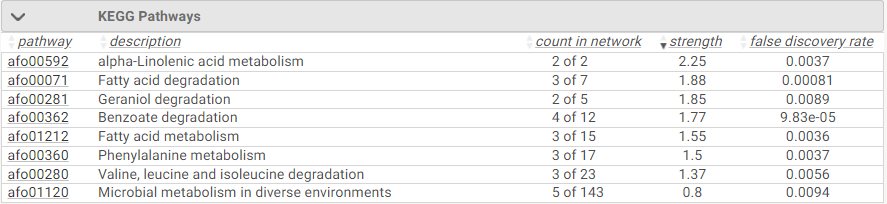
According to HTSeq output, this bin has expressed Putative enoyl-CoA hydratase EchA13 protein the most. From Phylophlan tree, we can see that this bin has placed next to Acidimicrobium ferrooxidans, and we can by looking at its location we can assume that this bin might be from Acidimicrobium genus. According to STRING, this protein is involved in numerous degradation pathways.
As it can be seen from HTSeq output, this bin has expressed Elongation factor Tu the most, while it is placed under Nitrosopumilaceae genus in PhyloPhlan. According to STRING, this protein is involved in the following pathway(s) in this genus:
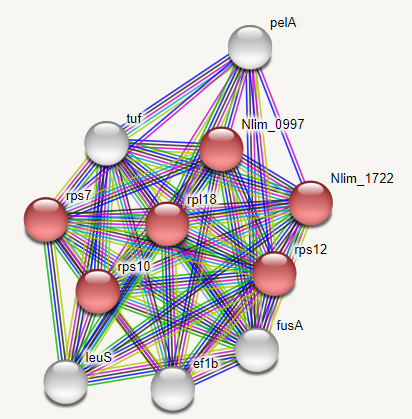
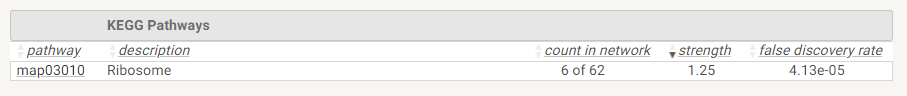
By looking at the graph and table, we can see that the pathway that this protein is involved with is a translational process.
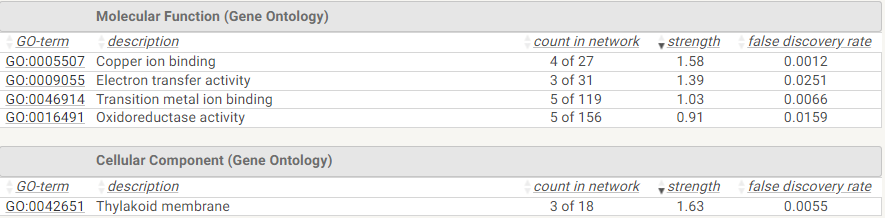
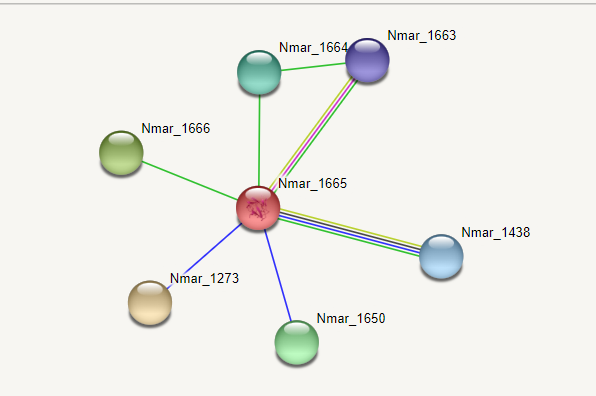
This bin is located under Nitrosopumilaceae genus as well, and has expressed Plastocyanin protein the most. According to the pathway information by STRING, it takes role in electron transfer activity during photosynthesis.
This bin is placed with Solirubrobacterales family by Phylophlan, and has expressed Glutamine synthetase the most according to the HTSeq output. STRING pathway information is as the following:
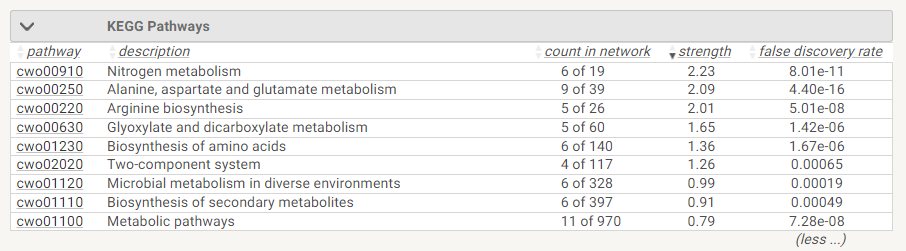
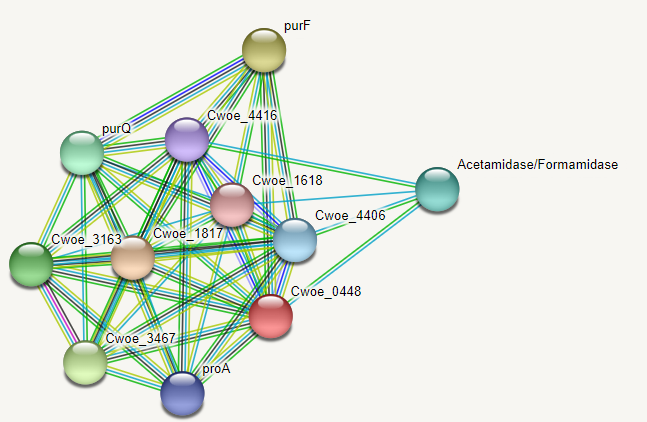
As also the name suggests, this protein is mostly involved with synthesis pathways.
For this analysis, I have chosen two genes that belongs to two different gene groups, and also expressed differently according to HTSeq analysis. One of the genes is Plastocyanin, which is involved in photosynthesis and mostly expressed in D3 samples, and the other one is Chaperone protein DnaK, which takes part in DNA replication, and mostly expressed in D1 sample. I wanted to see the expression difference of these genes in two samples.
I started with Plastocyanin, and I tried to find the gene count in D1 sample bins. Plastocyanin is annotated and expressed in the following bins with the following gene counts:
Bin3: 0
Bin4: 763
Bin6: 183
Bin7: 1
Bin8: 753
Although the numbers for Bin4 and Bin8 seem to be high, "hypothetical protein" for Bin4 and NAD(P)H-quinone oxidoreductase subunit I(chloroplastic) gene for Bin8 has been expressed more than Plastocyanin, and the numbers are relatively small for Bin183 and almost no Plastocyanin is expressed for Bin7 and Bin3.
Following are the bins that Prokka has anotated the protein in, and they are expressed with the following gene counts:
Bin4: 95
Bin5: 144
Bin8: 6
Bin11: 2
Bin15: 32
Bin22: 14
Bin23: 96
Bin25: 29
Bin26: 11
Bin27: 5
Bin28: 195
Bin29: 83
Bin30: 4
Here the numbers are more meaningful since this protein takes part in DNA replication, which eventually leads to cell division, and this process happens in all prokaryotes as well, therefore, increased numbers might mean that that organism is either going through a cell division or preparing for it.