
Drop-in OpenTelemetry observability for Python LLM apps. Standalone or with any OTLP backend — runs on your machine, sends nothing unless you ask it to.




Bitfrost turns the OpenTelemetry spans your LLM libraries already emit into a clean, queryable event stream — in your terminal, in a local web dashboard, in SQLite, or shipped to any backend you choose. One line to start, zero accounts required.
import bitfrost

bitfrost.quickstart(agent="my-app")   # auto-detects openai / anthropic / litellm / smolagents
# ...your normal LLM calls now stream to the terminal, color-coded, with tokens + cost.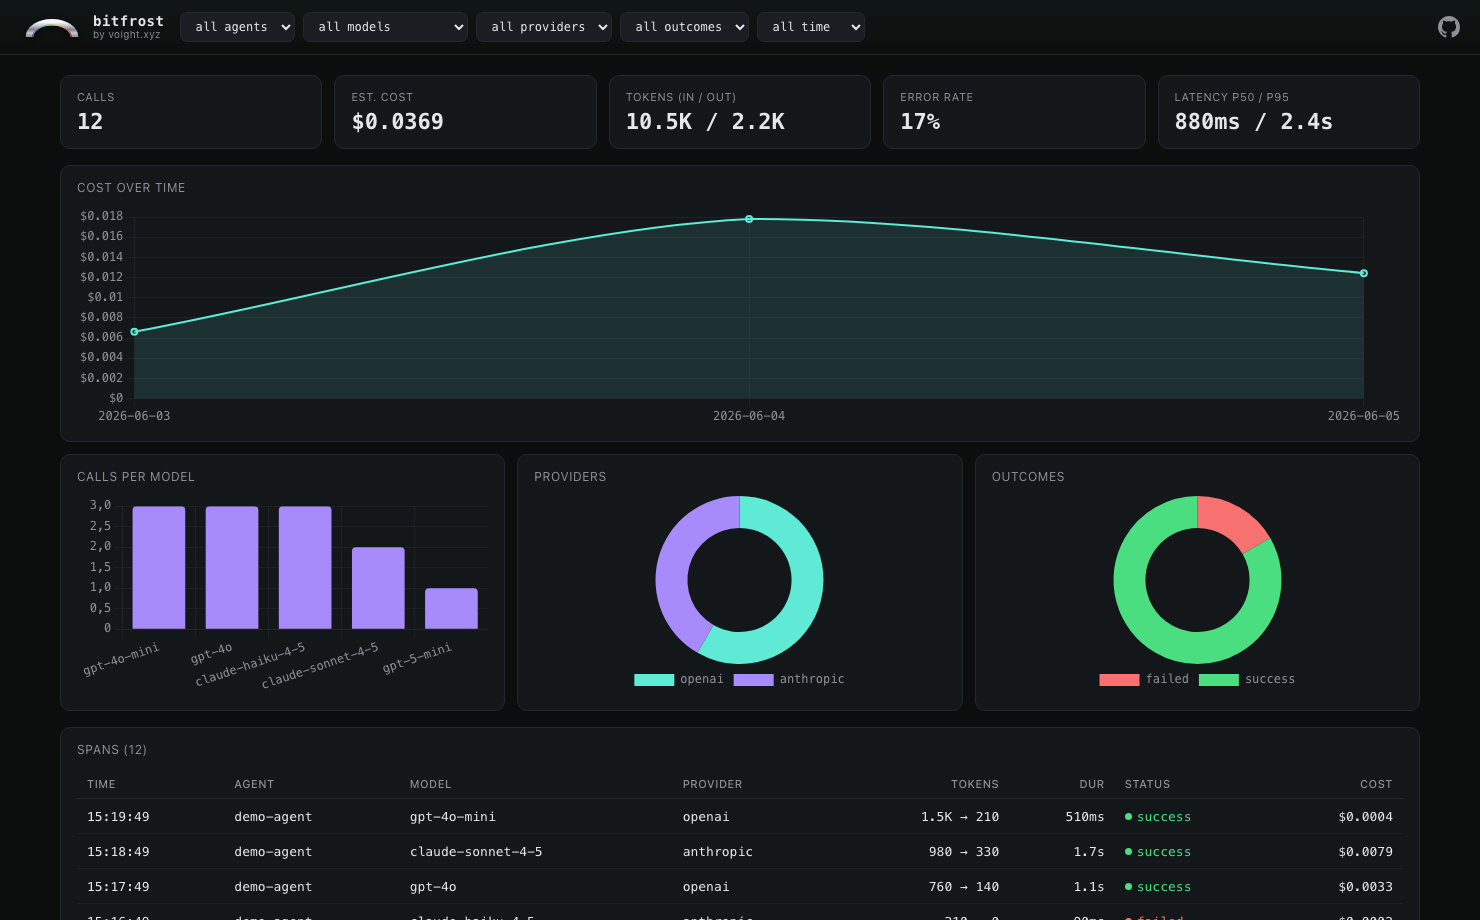
bitfrost serve capture.db — a local, offline dashboard. No account, no upload.
- Standalone first. Capture to your terminal, a JSONL file, or SQLite with zero configuration and zero network calls. Voight is one optional backend, never a requirement.
- Drop-in. Built on the OpenTelemetry GenAI semantic conventions, so it works with the instrumentation libraries you already use — across both the v1.27 and v1.32+ attribute generations.
- Batteries included. Five backends, four auto-instrument helpers, a rich CLI, an interactive TUI, and an offline web dashboard.
- Private by default. Three privacy levels with PII scrubbing (12 patterns + Luhn) applied before any event leaves the process.
- Never crashes your app. Every failure path degrades gracefully — a dead endpoint or a missing optional dependency never takes down your code.
pip install bitfrost                 # core
pip install 'bitfrost[cli,serve]'    # + CLI, TUI and local web dashboard
pip install 'bitfrost[all]'          # everything
Python 3.10–3.13.
Pick a backend and pass it to any instrument helper (or quickstart). All concrete backends live under bitfrost.backends.*:
| Backend | Import | Use it for |
|---|---|---|
| Console | bitfrost.backends.console.ConsoleBackend |
live, color-coded terminal output |
| SQLite | bitfrost.backends.sqlite.SQLiteBackend |
persistent local log; powers bitfrost serve |
| JSONL | bitfrost.backends.jsonl.JSONLBackend |
one JSON object per line; replay-able |
| OTLP/HTTP | bitfrost.backends.otlp.OTLPBackend |
POST events as JSON to any collector or webhook |
| Voight | bitfrost.backends.voight.VoightBackend |
hosted dashboards (optional, opt-in) |
| Tee | bitfrost.backends.tee.TeeBackend |
fan out to several backends at once |
import bitfrost
from bitfrost.backends.sqlite import SQLiteBackend

bitfrost.instrument_openai(backend=SQLiteBackend("events.db"), agent="my-app")
# then:  bitfrost serve events.db
Fan out to several at once:
import bitfrost
from bitfrost.backends.tee import TeeBackend
from bitfrost.backends.console import ConsoleBackend
from bitfrost.backends.sqlite import SQLiteBackend

bitfrost.instrument_auto(
    backend=TeeBackend(ConsoleBackend(), SQLiteBackend("events.db")),
    agent="my-app",
)import bitfrost
bitfrost.instrument_openai() # opentelemetry-instrumentation-openai
bitfrost.instrument_anthropic() # opentelemetry-instrumentation-anthropic
bitfrost.instrument_litellm() # litellm CustomLogger adapter
bitfrost.instrument_smolagents() # openinference-instrumentation-smolagents
bitfrost.instrument_auto() # instrument every supported lib that's installedAlready wiring OpenTelemetry yourself? Skip the helpers and attach the exporter to your own TracerProvider:
from opentelemetry.sdk.trace import TracerProvider
from opentelemetry.sdk.trace.export import BatchSpanProcessor
from bitfrost.exporter import BitfrostExporter
from bitfrost.backends.console import ConsoleBackend

provider = TracerProvider()
provider.add_span_processor(
    BatchSpanProcessor(BitfrostExporter(ConsoleBackend(), agent="my-app"))
)bitfrost watch capture.db # live tail, one styled line per event
bitfrost replay capture.jsonl # re-render a captured run start to finish
bitfrost query capture.db "SELECT model, COUNT(*) FROM events GROUP BY model"
bitfrost vacuum capture.db --keep-days 7
bitfrost tui capture.db # full-screen interactive dashboard
bitfrost serve capture.db # local web dashboard at http://127.0.0.1:8080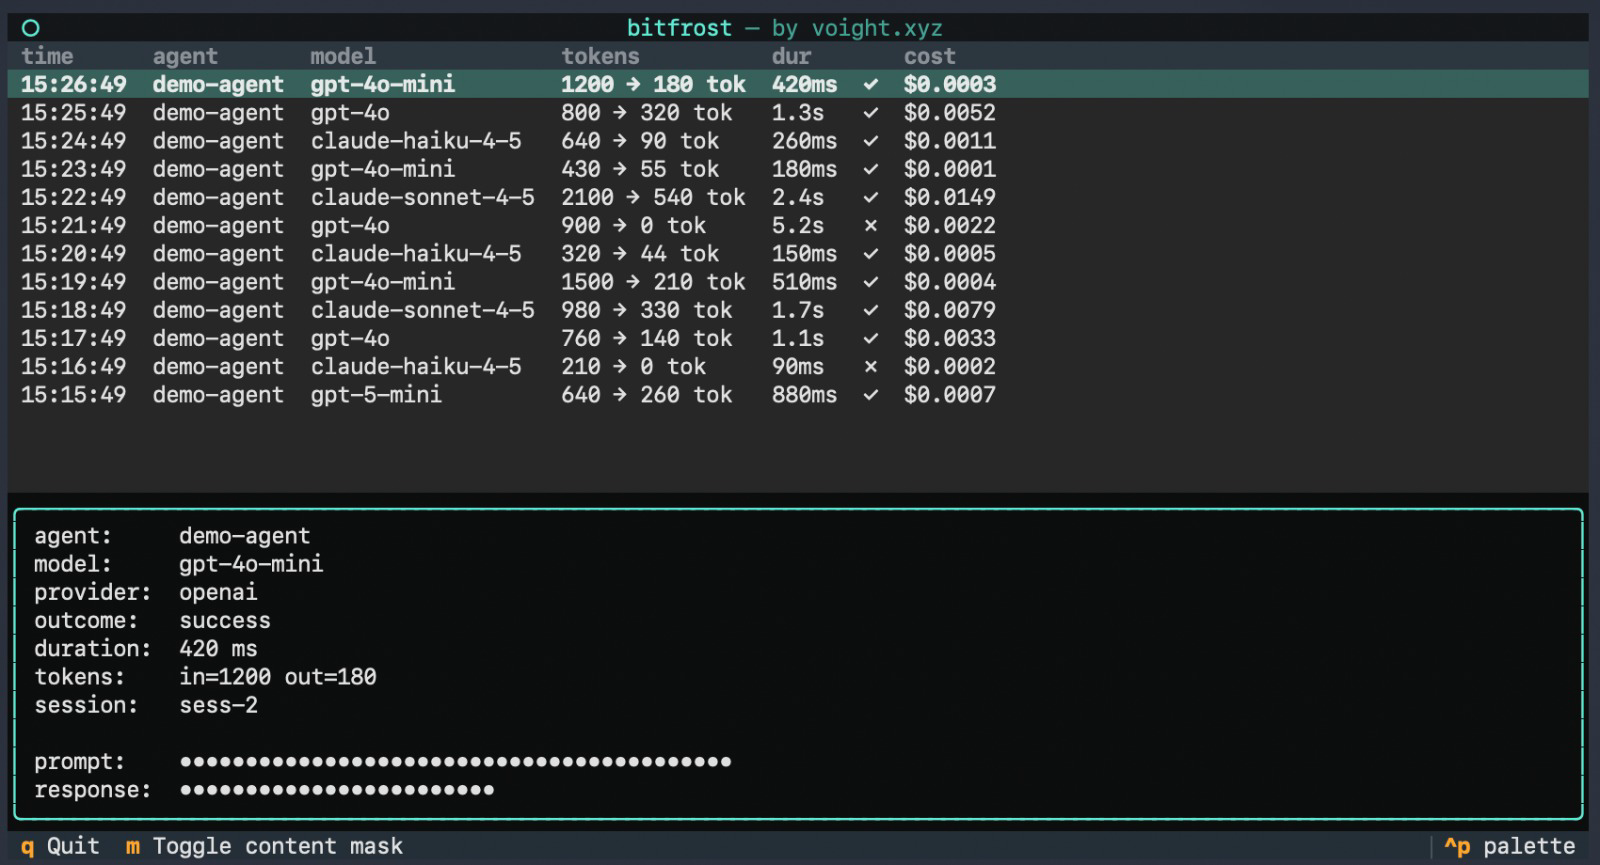
bitfrost tui — the same capture, navigable in your terminal. Prompts masked by default.
Three levels, applied in-process before any event is sent:
minimal— metadata only, no prompt/response contentstandard(default) — content kept, PII scrubbed (12 patterns + credit-card Luhn check)full— everything verbatim (use only for local debugging)
bitfrost.instrument_openai(privacy="minimal")Bitfrost is useful entirely on its own — the core has no dependency on any hosted service. If you want managed dashboards, team sharing, and per-user cost attribution, the optional VoightBackend ships your events to voight.xyz. Everything else stays exactly the same.
- Cookbook — task-oriented recipes
- Write your own backend — the
ExportBackendprotocol - Full docs: docs.voight.xyz/python/bitfrost
MIT. Built by Voight.