We analyze the data, program the server and communication, process the data, make conclusions & cool models.
- Tanmayi Dasari - rising junior at Cupertino High School
- Sebastian Hazl- rising junior at the Webb Schools of California
- Claire Lee - rising senior at Canyon Crest Academy
- Alex Miller - rising senior at Mountain View High School
- Dorothy Zhang - rising junior at Menlo School
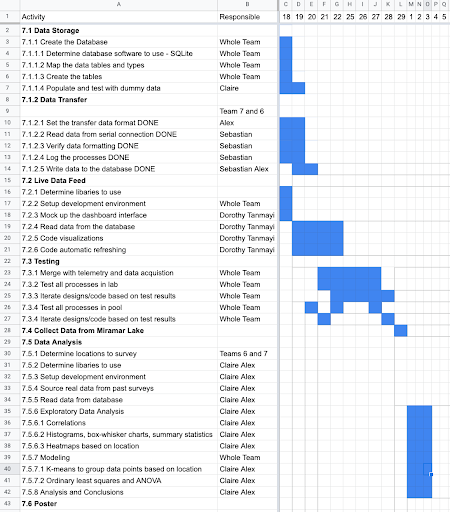
During the first week of our 4-week program, our team worked on getting familiar with the project, what changes we would be making to our RC boat, dividing up tasks, learning CAD, and understanding Arduino. Below is a Gantt chart of our last 3 weeks that we created to map out our work.
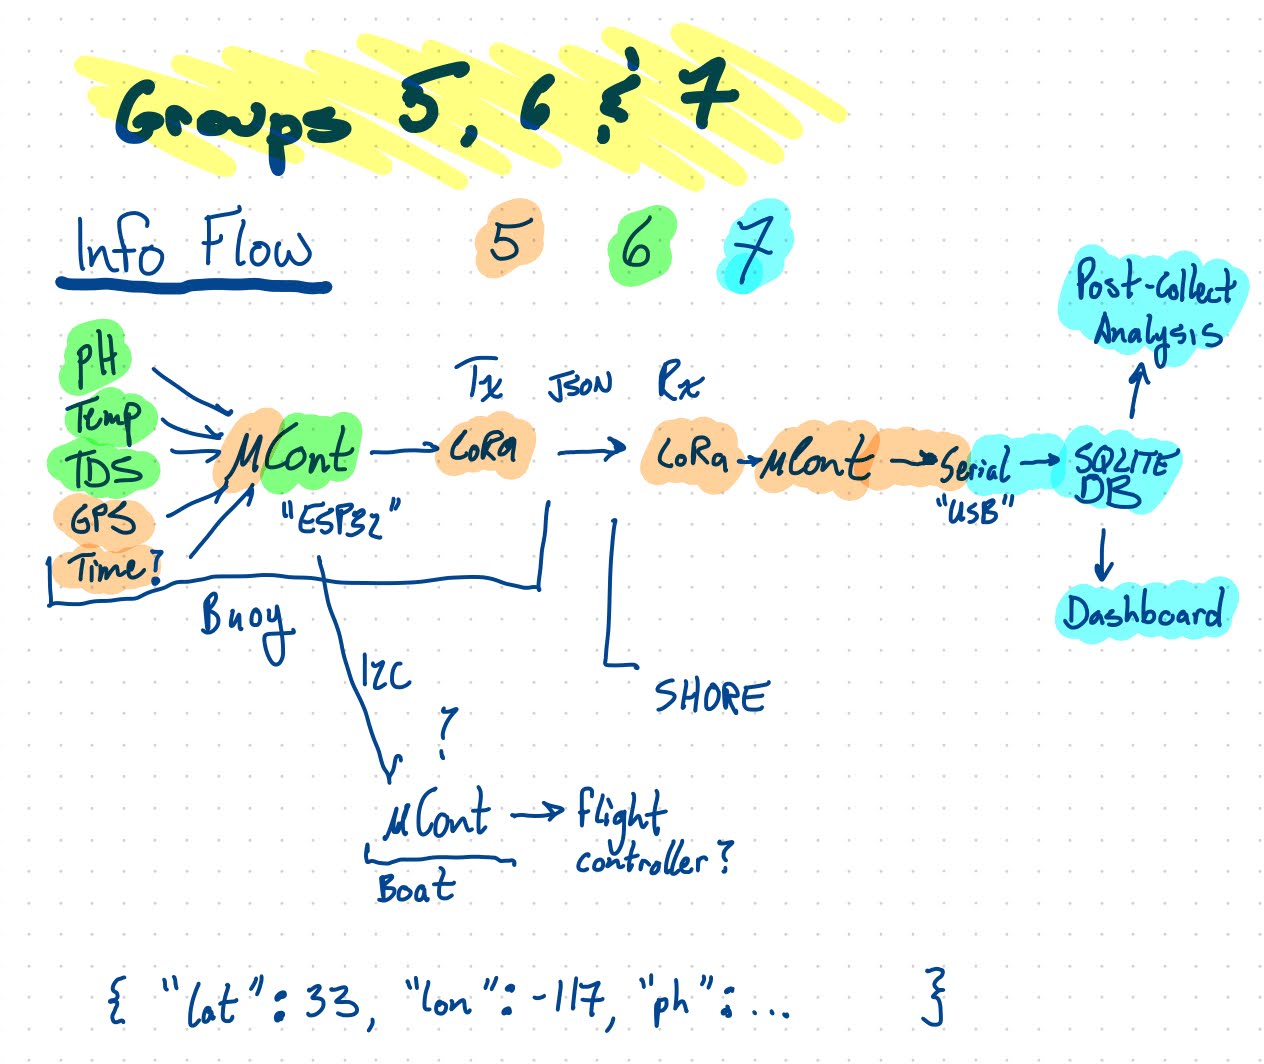
Additonally, here is our initial brainstorming diagram displaying the flow of data towards the server from the boat/data buoy. This diagram is an overview of Groups 5, 6, and 7. The highlighted blue section on the right is what our team worked on and the formatting at the bottom is what our data looks like.
During the second week, Group 7 learned about database structure using SQLite and created a database to store sensor, GPS, and timestamp data. We also decided on using serial with Group 6. Sebastian started working on transferring the data from serial to the database using Python. Dorothy and Tanmayi decided on using Plotly Dash as the library for the dashboard and planned out the layout of the dashboard. Claire and Alex started to learn Python to create models. Claire delved into exploratory data analysis and started learning about K-means clustering, linear regression, and goodness of fit for our data analysis. Meanwhile, Alex set up the server with the Linux OS.