Find AI crawlers in your server logs. Locally. In your browser. No backend
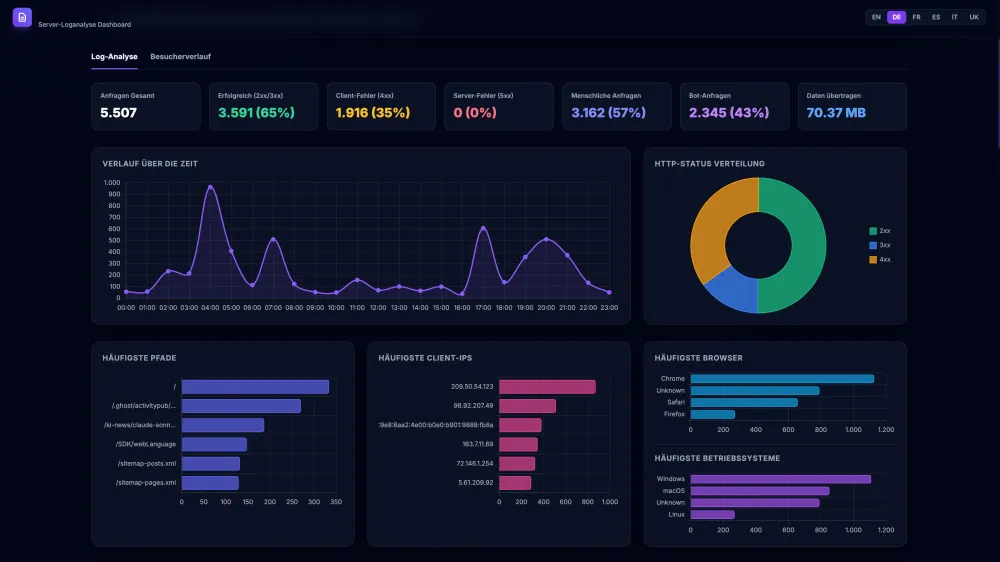


▶ Try the live demo — click "Load a sample log" to explore a fully anonymized example dataset right in your browser. · Changelog
LogWerk is a lightweight, offline-first server log analyzer dashboard that runs entirely in your web browser. Drop in an Nginx or Apache access log — the format is detected automatically — or bring your own custom pattern, and instantly get an interactive analytics dashboard — no backend, no database, no data ever leaves your machine.
It's built for developers, sysadmins, and site operators who want a quick, private way to understand their traffic: who's visiting, which bots are crawling, what's failing, and how real users are moving through the site — without setting up a full log-analytics stack.
Heavyweight stacks (ELK, Grafana Loki, GoAccess) need setup and maintenance; cloud services (Datadog, Loggly) want you to upload your raw logs. LogWerk is neither.
- Your log data stays local — Parsed entirely in the browser, never uploaded, no account. (The UI loads Tailwind/Chart.js/fonts from CDNs; vendor them locally for a fully offline build.)
- Minimal setup — No build, no database, no config. Just serve the folder from any static server.
- Built for the AI-crawler era — Recognizes 70+ crawlers by provider and purpose — e.g. OAI-SearchBot fetched your pages for ChatGPT search vs GPTBot scraped them for training — instead of one generic "bot" bucket.
- Bot filtering that helps — Toggle Humans Only, or drill into a single named bot to answer "Is Bytespider hammering my site?" or "How much traffic is real people?"
- More than counts — Session timelines, an attack-pattern Security tab, and offline visitor-country lookup make it an investigation tool, not just a counter.
- Zero backend, 100% client-side: Pure HTML5, ES6 modules, and Tailwind CSS. Your log files never leave the browser.
- Automatic format detection (default): Matches a sample of your file against every known format and picks the one that fits — you don't need to know whether your hoster writes combined, vhost_combined or something extended. Manual selection stays available.
- Multiple log format presets: Nginx/Apache Combined, Nginx Extended, Apache vhost_combined (Debian/Ubuntu
other_vhosts_access.log, cPaneldomlogs), Apache Common, or bring your own Custom RegEx pattern. - Cache & performance analysis: For nginx setups logging
$upstream_cache_status,$request_timeand friends, the Nginx Extended preset adds an upstream cache hit-rate breakdown, the slowest paths by average response time, and per-request host, cache status, timing, content type and TLS protocol in the detail inspector and CSV export. - Compressed & rotated logs: Load gzip-compressed rotation files (
access.log.2.gz) directly — detected by magic bytes and decompressed in the browser via the nativeDecompressionStreamAPI. Plain rotated files (access.log.1) work too. - Async, chunked parsing: Large log files are parsed in the background without freezing the UI.
- Interactive analytics dashboard: Traffic over time, HTTP status distribution, top paths, top client IPs, browsers, and operating systems — all rendered with Chart.js.
- Traffic insights: Top traffic sources (referrer), content type breakdown (pages, images, JS/CSS, API, feeds), top paths by data volume, HTTP protocol version distribution, and a weekday × hour traffic heatmap.
- Crawler & Sources tab: Turns the log into answers — the paths where bots burn crawl budget on 3xx/4xx/5xx, how much data each bot pulls (with its type, so a
curlscript isn't mistaken for a crawler), pages fetched only by AI crawlers, top landing pages with their traffic source, and referring URLs at full path depth with external sources first. - Broken inbound links: 404s reached from a link on someone else's site — the ones worth redirecting, separated from scanner noise. Needs your domain, which is read from the log where the format carries it and otherwise derived and shown for correction.
- Security tab: Detects known attack patterns (config/secret probes, CMS/PHP exploits, device/server exploits, admin panel scans, path traversal, proxy/DNS abuse), lists the most active suspicious IPs, top 404 error paths, and failed logins (401) per IP.
- Bot traffic intelligence: Detects and classifies 70+ known bots and crawlers (search engines, AI crawlers, SEO tools, social media previews, Fediverse/ActivityPub crawlers, security scanners) with provider and purpose breakdowns.
- Offline Geo-IP badges: Visual country indicators per request, resolved entirely offline.
- User Session Reconstruction: Groups requests by client fingerprint (IP + User-Agent) into chronological session timelines, with filters for minimum clicks, session type, and sorting.
- Powerful filtering & search: Search by IP, path, status, referer, or user agent; filter by traffic type, specific bot, status code, HTTP method, and sort entries by log age (oldest/newest first).
- Detail inspector: Click any row to open a full breakdown of client, request, and user-agent metadata.
- CSV export: Export the currently filtered result set.
- Reload persistence: The last loaded log is cached in IndexedDB and automatically restored on refresh.
- Multilingual UI: English, German, French, Spanish, Italian, and Ukrainian, fully translated and switchable at runtime.
- Light & dark mode: Switch themes with one click in the header. Follows your OS preference on first visit, remembers your choice, and recolors the charts to match.
Modern browsers restrict loading local JavaScript modules via the file:// protocol due to CORS security rules. Choose one of the following methods to run the dashboard:
Open your terminal in the project directory and run one of these commands:
- Python:
python3 -m http.server 8000 - Node.js:
npx serveornpx http-server - PHP:
php -S localhost:8000
Then open your browser and go to: http://localhost:8000
To stop the server, press Ctrl + C in your terminal.
- Open Safari.
- Go to Settings -> Advanced and enable "Show features for web developers".
- In the Safari menu bar, select Develop -> check "Disable Local File Restrictions".
- Double-click
index.htmlto open it.
- Load Log: Drag and drop your server log file (e.g.,
access.log,access.log.1, oraccess.log.2.gz) into the top dropzone. - Format Preset: Leave it on Detect format automatically (the default) and LogWerk works out the format from the file itself. It recognizes Nginx/Apache Combined, Nginx Extended, Apache vhost_combined and Apache Common; pick one by hand, or supply a Custom RegEx, whenever you want to override it.
- Filter: Search by IP, path, status, referer, or filter traffic by Humans Only / Bots Only (which opens a specific bot dropdown selector). Sort entries by log age, oldest or newest first.
- Inspect: Click on any row in the table to slide open detailed client and request metadata.
- Switch tabs: Log Analysis holds the charts and the table, Session Journeys the per-visitor timelines, Crawler & Sources the bot and referrer reports, and Security the attack patterns and 404s. On the Crawler tab, check the own domain field at the top — internal and external links can only be told apart once it is right, and when the log format carries no host it is derived from the referrers and shown as the guess it is.
- Reload Persistence: The last loaded log file is cached inside the browser's IndexedDB. If you refresh the page, it is restored automatically!
This project runs entirely on the client side and fetches the following resources via CDNs:
- Tailwind CSS (v3): Utility-first CSS framework for layout styling. (CDN:
https://cdn.tailwindcss.com| License: MIT) - Chart.js (v4): Canvas-based HTML5 rendering of analytics charts. (CDN:
https://cdn.jsdelivr.net/npm/chart.js| License: MIT) - Google Fonts (Inter / Outfit): Typography styling. (CDN:
https://fonts.googleapis.com| License: OFL - SIL Open Font License)
This project is licensed under the terms of the MIT License:
MIT License

Copyright (c) 2026 Tobias Glawe

Permission is hereby granted, free of charge, to any person obtaining a copy
of this software and associated documentation files (the "Software"), to deal
in the Software without restriction, including without limitation the rights
to use, copy, modify, merge, publish, distribute, sublicense, and/or sell
copies of the Software, and to permit persons to whom the Software is
furnished to do so, subject to the following conditions:

The above copyright notice and this permission notice shall be included in all
copies or substantial portions of the Software.

THE SOFTWARE IS PROVIDED "AS IS", WITHOUT WARRANTY OF ANY KIND, EXPRESS OR
IMPLIED, INCLUDING BUT NOT LIMITED TO THE WARRANTIES OF MERCHANTABILITY,
FITNESS FOR A PARTICULAR PURPOSE AND NONINFRINGEMENT. IN NO EVENT SHALL THE
AUTHORS OR COPYRIGHT HOLDERS BE LIABLE FOR ANY CLAIM, DAMAGES OR OTHER
LIABILITY, WHETHER IN AN ACTION OF CONTRACT, TORT OR OTHERWISE, ARISING FROM,
OUT OF OR IN CONNECTION WITH THE SOFTWARE OR THE USE OR OTHER DEALINGS IN THE
SOFTWARE.