


Clean, opinionated, vector-first scientific plotting for Python.
cleanfig is a small Rust/Python plotting package for clean scientific figures with vector-first export.
It is intentionally narrow: simple publication-style defaults, light visual clutter, compact labeling, and a small public API. The focus is on figures that should look close to final output without extensive styling code.
Useful links:
- Gallery: https://adakite.github.io/cleanfig/gallery/
- Documentation landing page: https://adakite.github.io/cleanfig/
- Repository: https://github.com/adakite/cleanfig
Install from PyPI:
pip install cleanfigInstall the latest development GitHub version:
pip install git+https://github.com/adakite/cleanfig.gitimport numpy as np
import cleanfig as cf
x = np.linspace(0, 10, 200)
y = np.sin(x)
fig = cf.figure(width="single", height=3.4, panel_labels=False)
ax = fig.panel(0, 0)
ax.line(x, y, label="signal")
ax.scatter(x[::20], y[::20], size=5)
ax.xlabel("x")
ax.ylabel("y")
fig.save("basic_line.svg")
fig.save("basic_line.html")
fig.save("basic_line.pdf")The package is designed to be used as:
import cleanfig as cfCurrent public entry points:
cf.figure(...)Figure.panel(row, col)Figure.save(path)Panel.scatter(...)Panel.line(...)Panel.bar(...)Panel.histogram(...)Panel.field(...)Panel.violin(...)Panel.box(...)Panel.colorbar(...)Panel.legend()Panel.xlabel(...)Panel.ylabel(...)Panel.right_ylabel(...)Panel.xscale(...)Panel.yscale(...)Panel.limits(...)Panel.right_limits(...)
cf.figure(width="single", height=4.0, grid=(1, 1), panel_labels=False, font=None, theme="publication")
width:"single"or"double"height: figure height in inchesgrid:(rows, cols)panel_labels: add panel lettersfont: custom font family stringtheme:"publication"/"nature"/"light"alias, or"dark"
ax.xlabel(label)ax.ylabel(label)ax.right_ylabel(label): label for a secondary right Y axisax.limits(x=None, y=None): explicit limits for the main X/Y axesax.right_limits(y=None): explicit limits for the right Y axisax.xscale("linear" | "log")ax.yscale("linear" | "log", axis="left" | "right")
Log scales require strictly positive values and strictly positive limits.
x,y: same-length numeric arrayscolor: named/hex color or numeric array for colormap mappingsize: marker diameter in pointsalpha: opacitylabel: legend entrycmap: colormap name for mapped colors; seeBuilt-in Colormapsbelowyaxis:"left"or"right"for dual-Y figures
Returns a PlotHandle when color mapping is used.
color: named/hex colorwidth: stroke width in pointsalpha: opacitylabel: legend entryyaxis:"left"or"right"
labels: categorical X labelsvalues: numeric heightsyaxis:"left"or"right"color: named/hex coloralpha: opacityshow_x_axis: draw the bottom X axis line and ticks for bar charts
ax.histogram(data, bins=12, range=None, density=False, color=None, alpha=1.0, label=None, yaxis="left")
data: numeric samplesbins: number of binsrange: optional(min, max)binning rangedensity: normalize to probability density instead of countscolor: named/hex fill coloralpha: opacitylabel: legend entryyaxis:"left"or"right"
grid: 2D numeric arraycmap: colormap name; seeBuilt-in Colormapsbelowcell_edges: draw subtle cell borders whenTruerender:"auto","grid", or"embedded"
render="auto" is the default. In the Rust backend, dense fields automatically switch to an embedded raster image to avoid visible seams between cells, while smaller fields remain grid/vector based. Use "grid" to force cell-by-cell rendering or "embedded" to force the rasterized field image path.
Returns a PlotHandle for optional colorbar creation.
handle: result of a mappedscatter,field, or mapped-pointviolinlabel: colorbar labelplacement:"right"or"inside-left"style:"binned"or"continuous"
Current default is "binned".
ax.violin(data, labels=None, show_median=False, points=False, point_color=None, point_size=4.0, point_alpha=0.75, point_cmap=None)
data: grouped numeric datalabels: category labelsshow_median: draw median segmentpoints: overlay individual pointspoint_color: constant color, flat array, or grouped arrayspoint_size: point diameterpoint_alpha: point opacitypoint_cmap: colormap for mapped points; seeBuilt-in Colormapsbelow
Returns a PlotHandle when mapped point colors are used.
data: grouped numeric datalabels: category labels
Creates a compact frameless legend from labeled layers.
- Supported: line, scatter, bar, histogram, violin, box, field plots with auto grid/embedded rendering
- Supported: light/dark themes, log X/Y axes, dual Y axes, SVG/HTML/PDF export
- Not supported yet:
ax.spectrogram(), logarithmic colorbars, geographic projections
Useful example scripts are provided in examples/:
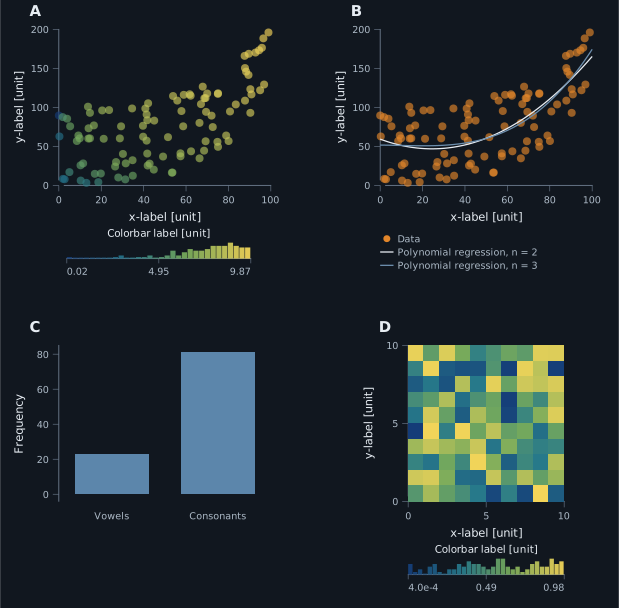
basic_line.pyfour_panels.pyviolin_box_light.pyesec_dual_y_light.pyfor a light-theme dual-Y example using apandas.DataFrameloaded from a bundled ESEC catalog extract inexamples/Data/- theme-specific wrappers for light/dark example output
Supported export targets:
SVGHTMLwith embedded SVGPDFthrough SVG conversion in the Rust backend
cleanfig currently ships with a larger built-in continuous colormap set.
General:
graymagmabone
Fabio Crameri family currently integrated:
- Sequential-ish:
acton,bamako,batlow,bilbao,devon,hawaii,imola,lajolla,lapaz,lipari,navia,nuuk,oslo,tokyo,turku - Diverging / balanced:
berlin,broc,cork,managua,roma,tofino,vanimo,vik
Notes:
- These Crameri maps were integrated as built-in names so the plotting API stays unchanged:
cmap="roma",cmap="batlow", etc. - Unknown colormap names still fall back to
batlow. - Colormap attribution and licensing notice: LICENSE-THIRD-PARTY.md
Citation for the integrated Scientific colour maps:
Crameri, F. (2023). Scientific colour maps (8.0.1). Zenodo. https://doi.org/10.5281/zenodo.8409685
- vector-first output
- clean left/bottom axes by default
- minimal plot constructors
- no GUI, dashboards, or heavyweight plotting state
- useful scientific defaults over maximum flexibility
cleanfig prefers the compiled Rust extension.
If the extension is unavailable, it falls back to a pure Python implementation. The fallback is intended for graceful local use and testing, but it is not feature-complete. In particular, PDF export is only available when the Rust backend is loaded.
You can inspect the active backend with:
import cleanfig as cf
print(cf.BACKEND)- no
ax.spectrogram()yet - no logarithmic colorbars
- no standalone raster plotting backend beyond embedded dense field rendering
- no geographic projections
- visual styling is intentionally constrained
- the Python fallback keeps field rendering grid-based even when
render="embedded"is requested
python -m venv .venv
source .venv/bin/activate
python -m pip install -U pip
python -m pip install -e ".[dev]"
maturin develop
pytest -q
The esec_dual_y_light.py example additionally expects pandas, which is included in the dev extra. The bundled ESEC source file and citation notes are stored under examples/Data/.
- License: MIT, see
LICENSE - Changelog:
CHANGELOG.md - Release checklist:
RELEASE.md - Contact: Antoine Lucas