What and where to eat in Pune(Zomato Dataset + MatplotLib + SeaBorn + pandas + Map Location for restaurant)
From Zomato's dataset and implemented only for Pune location, find out which is the best continental restaraunt in Pune by vistalization
#API for Zomato Dataset https://developers.zomato.com/documentation
https://developers.zomato.com/api
Codes below are more specific to Pune location only because I live there.
import matplotlib.pyplot as plt #plot the charts.
import pandas as pd
dataset = dataset.drop(['Country Code', 'Currency', 'Is delivering now', 'Switch to order menu',  ], axis=1)

#city = dataset.iloc[:,1].values
#city = pd.DataFrame(city)

uniquevalues_city = np.unique(dataset[['City']].values)
uniquevalues_city = pd.DataFrame(uniquevalues_city)

new_dataset_city = dataset[dataset['City'] == "Pune"]
new_dataset_city = new_dataset_city.drop(['Restaurant ID'], axis =1)

rating = new_dataset_city.iloc[:,11].values
Avg_cost_for_two = new_dataset_city.iloc[:, 7].values
plt.figure(figsize = (12, 10), facecolor = None)
import seaborn as sns
sns.set_style("darkgrid")
plot1 = sns.barplot(x="Aggregate rating", y="Average Cost for two", data=new_dataset_city)
types = {
    "Breakfast and Coffee" : ["Cafe Coffee Day", "Starbucks", "Barista", "Costa Coffee", "Chaayos", "Dunkin' Donuts"],
    "American": ["Domino's Pizza", "McDonald's", "Burger King", "Subway", "Dunkin' Donuts", "Pizza Hut"],
    "Ice Creams and Shakes": ["Keventers", "Giani", "Giani's", "Starbucks", "Baskin Robbins", "Nirula's Ice Cream"],
    "Continental": ["Teddy Boy","Effingut Brewerkz","Mineority By Saby","Effingut Brewerkz","Sauted Stories","German Bakery Wunderbar","Blue Water","Agent Jack's Bar","Tales & Spirits"],
    "North Indian" : ["The Urban Foundry","Teddy Boy","Effingut Brewerkz","Mineority By Saby","Effingut Brewerkz","Kargo","Barbeque Nation","Blue Water","Agent Jack's Bar","18 Degrees Resto Lounge","Barbeque Ville"]
}
breakfast = new_dataset_city.loc[new_dataset_city['Restaurant Name'].isin(types['Breakfast and Coffee'])]
american = new_dataset_city.loc[new_dataset_city['Restaurant Name'].isin(types['American'])]
ice_cream = new_dataset_city.loc[new_dataset_city['Restaurant Name'].isin(types['Ice Creams and Shakes'])]
continental = new_dataset_city.loc[new_dataset_city['Restaurant Name'].isin(types['Continental'])]
north_indian = new_dataset_city.loc[new_dataset_city['Restaurant Name'].isin(types['North Indian'])]
cafe_name = new_dataset_city.iloc[:,0].values
Avg_cost_for_two = new_dataset_city.iloc[:, 7].values
plt.figure(figsize = (8, 6), facecolor = None)
sns.set_style("darkgrid")
x_ax = new_dataset_city['Restaurant Name']
y_ax = new_dataset_city['Aggregate rating'].apply(lambda x: round(x,2))
plot2 = sns.barplot(x=x_ax, y=y_ax, data=new_dataset_city)
plot2.set_xticklabels(new_dataset_city['Restaurant Name'], rotation=90, ha="center")

plot2.set(xlabel='Restaurant Name', ylabel=u'Average Cost for two')
plot2.set_title('Cafe_name vs Avg_cost_for_two')
breakfast_locations = breakfast[['Restaurant Name','Locality Verbose' ,'City',
                                'Longitude','Latitude','Average Cost for two','Aggregate rating',
                                'Rating text']].reset_index(drop=True)
breakfast_locations['Text'] = breakfast_locations['Restaurant Name'] + "<br>Rating: "+breakfast_locations['Rating text']+" ("+breakfast_locations['Aggregate rating'].astype(str)+")" + "<br>" + breakfast_locations['Locality Verbose']
mapbox_access_token = 'pk.eyJ1Ijoic3cxMjMiLCJhIjoiY2pqZDlja2NqMGt1MzNrcDJyc280NnhqbyJ9.Vr1RLSptPrL0rQak9VAJfw'

continental_X = continental.iloc[:,0].values
continental_X = pd.DataFrame(continental_X)
continental_Y = continental.iloc[:,12].values
plt.figure(figsize = (10, 8), facecolor = None)
sns.set_style("darkgrid")
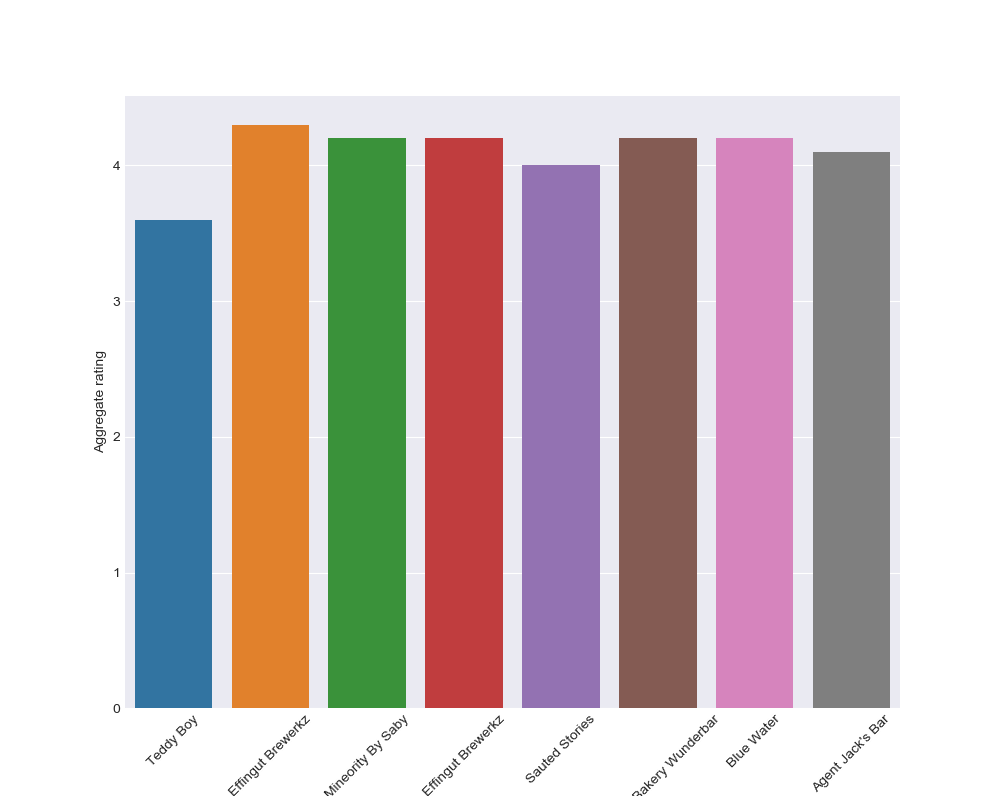
x_ax1 = continental['Restaurant Name']
y_ax1 = continental['Aggregate rating'].apply(lambda x: round(x,2))
plot3 = sns.barplot(x=x_ax1, y=y_ax1, data=continental)
plot3.set_xticklabels(continental['Restaurant Name'], rotation=45, ha="center")
plt.figure(figsize = (10, 8), facecolor = None)
sns.set_style("darkgrid")
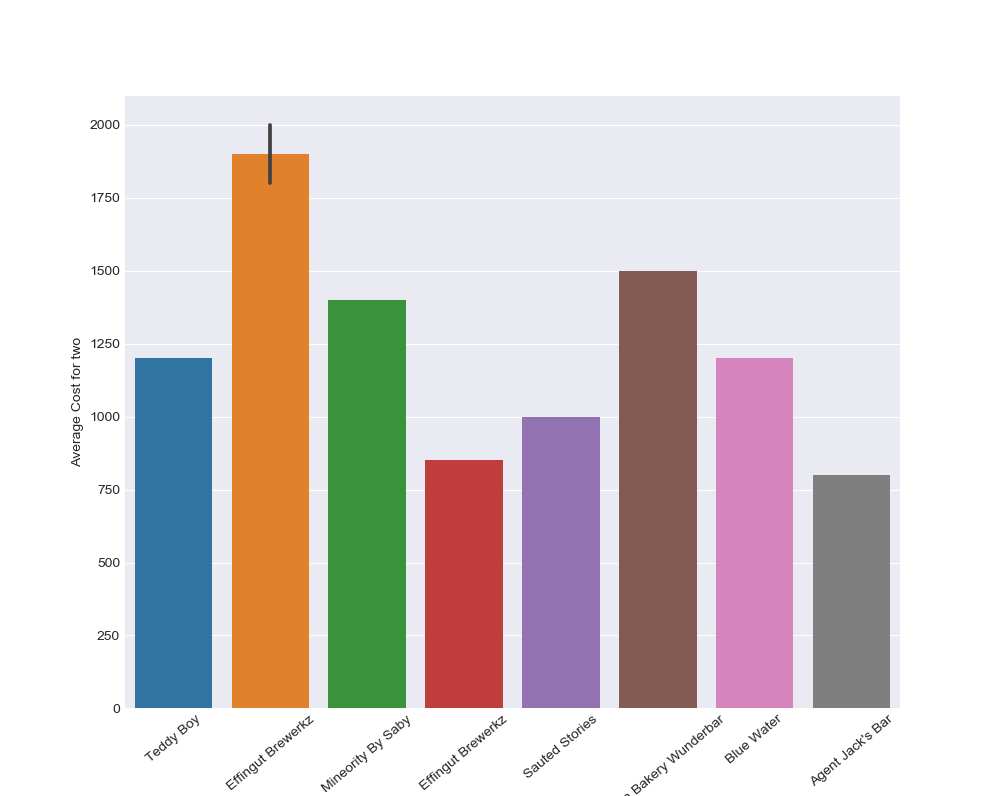
x_ax2 = continental['Restaurant Name']
y_ax2 = continental['Average Cost for two'].apply(lambda x: round(x,2))
plot4 = sns.barplot(x=x_ax2, y=y_ax2, data=continental)
plot4.set_xticklabels(continental['Restaurant Name'], rotation=40, ha="center")