A maintained Angular 22 wrapper for Highcharts, Highstock, and Highmaps applications, with standard chart rendering, constructor switching, module registration, directive event outputs, native chart instance access, realtime data demos, and Angular-versioned release lines.






Documentation & Live Demos | Angular 22 Demo | StackBlitz | npm | Issues | Repository | Community Discussions
Angular 22 release: 22.1.1
Credits: Original Angular Highcharts wrapper lineage by Eugene Gluhotorenko. Current Stackline maintenance, Angular release-line packaging, docs, live tests, publishing, and repository stewardship by Alexandro Paixao Marques.
@stackline/angular-highcharts keeps the early Angular Highcharts wrapper API alive while making it usable in a maintained, versioned Stackline package line.
The goal is not to hide Highcharts. The package stays thin: your application still owns the real Highcharts options object, the Highcharts constructor choice, module registration, event handling, and native chart instance. The wrapper gives Angular templates a stable <chart> component, Angular event outputs, axis/series/point directives, and release families aligned to Angular majors.
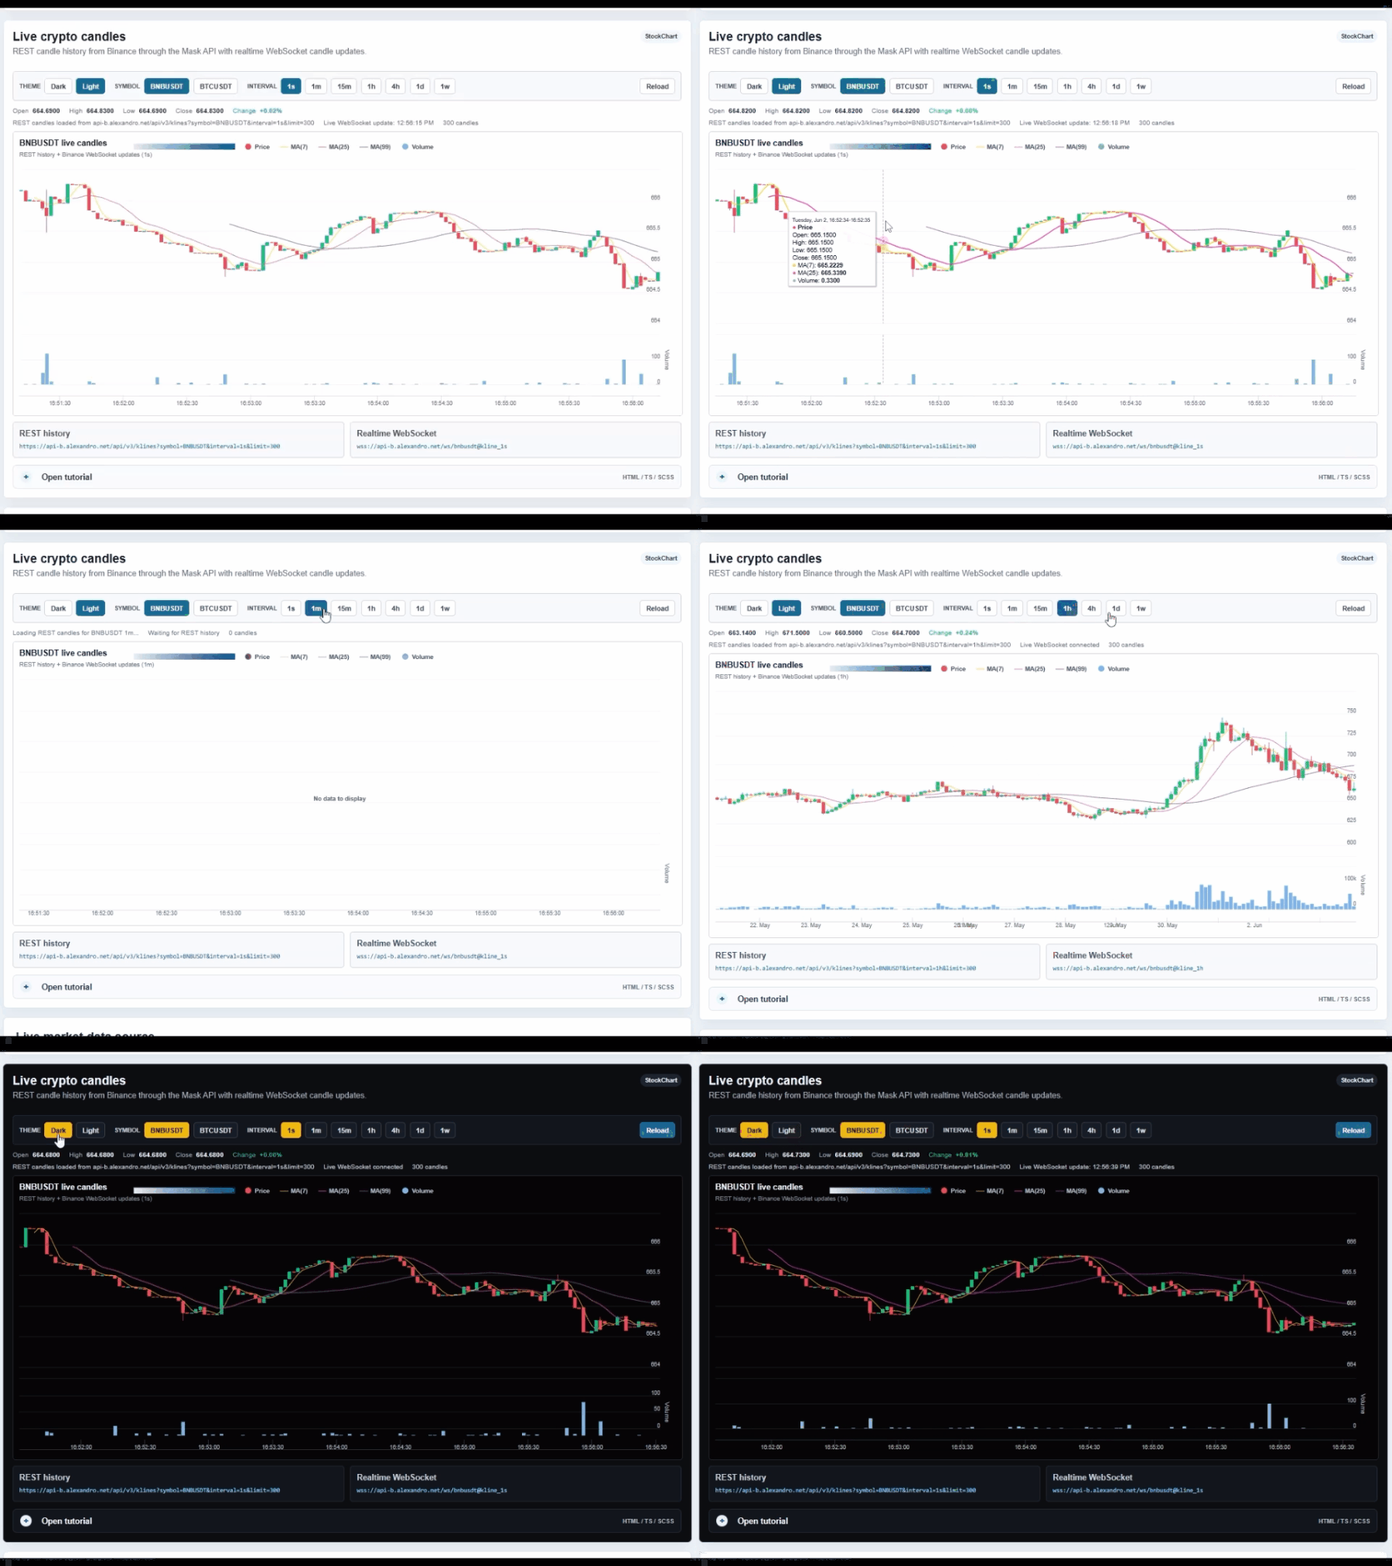
The Angular 22 package family is 22.1.1 and is intended for Angular 22.x applications. The live validation app uses Angular 22.1.3 and Highcharts 13.0.1, renders static and realtime examples, and validates that dynamic charts update existing Highcharts instances instead of blinking through full object recreation.
| Feature | Supported |
|---|---|
| Angular 22 tested package line | ✅ |
Standard Highcharts.Chart rendering |
✅ |
StockChart constructor support |
✅ |
| Highmaps constructor support when Highmaps is registered | ✅ |
Highcharts module registration through ChartModule.forRoot(...) |
✅ |
| Native Highcharts options object | ✅ |
Native chart instance access through (create) |
✅ |
| Chart event outputs | ✅ |
| Series event outputs | ✅ |
| Point event outputs | ✅ |
xAxis and yAxis directive outputs |
✅ |
zAxis directive outputs |
✅ |
colorAxis directive outputs |
✅ |
| Dynamic data updates | ✅ |
| Realtime WebSocket demo coverage | ✅ |
| REST history + live candle demo coverage | ✅ |
| Static examples for common chart types | ✅ |
| Versioned docs builds per Angular line | ✅ |
- Angular Version Compatibility
- Installation
- Setup
- Basic Usage
- Constructor Switch
- Highcharts Modules
- Events and Directives
- Native Chart Instance
- Common Chart Types
- Dynamic Updates
- API Surface
- Wrapper Capabilities
- License
Each package family targets one Angular major. Keep the package major aligned with the Angular major used by your application.
| Package family | Angular family | Peer range | Install |
|---|---|---|---|
22.x |
Angular 22.x |
>=22.0.0 <24.0.0 |
npm install @stackline/angular-highcharts@22.1.1 highcharts@13.0.1 --save-exact |
21.x |
Angular 21.x |
>=21.0.0 <22.0.0 |
npm install @stackline/angular-highcharts@21.0.0 highcharts@12.6.0 --save-exact |
20.x |
Angular 20.x |
>=20.0.0 <21.0.0 |
npm install @stackline/angular-highcharts@20.0.0 highcharts@12.6.0 --save-exact |
19.x |
Angular 19.x |
>=19.0.0 <20.0.0 |
npm install @stackline/angular-highcharts@19.0.0 highcharts@12.6.0 --save-exact |
18.x |
Angular 18.x |
>=18.0.0 <19.0.0 |
npm install @stackline/angular-highcharts@18.0.0 highcharts@12.6.0 --save-exact |
17.x |
Angular 17.x |
>=17.0.0 <18.0.0 |
npm install @stackline/angular-highcharts@17.0.0 highcharts@12.6.0 --save-exact |
16.x |
Angular 16.x |
>=16.0.0 <17.0.0 |
npm install @stackline/angular-highcharts@16.0.0 highcharts@12.6.0 --save-exact |
15.x |
Angular 15.x |
>=15.0.0 <16.0.0 |
npm install @stackline/angular-highcharts@15.0.0 highcharts@12.6.0 --save-exact |
14.x |
Angular 14.x |
>=14.0.0 <15.0.0 |
npm install @stackline/angular-highcharts@14.0.0 highcharts@12.6.0 --save-exact |
13.x |
Angular 13.x |
>=13.0.0 <14.0.0 |
npm install @stackline/angular-highcharts@13.0.0 highcharts@12.6.0 --save-exact |
12.x |
Angular 12.x |
>=12.0.0 <13.0.0 |
npm install @stackline/angular-highcharts@12.0.0 highcharts@12.6.0 --save-exact |
11.x |
Angular 11.x |
>=11.0.0 <12.0.0 |
npm install @stackline/angular-highcharts@11.0.0 highcharts@10.3.3 --save-exact |
10.x |
Angular 10.x |
>=10.0.0 <11.0.0 |
npm install @stackline/angular-highcharts@10.0.0 highcharts@10.3.3 --save-exact |
9.x |
Angular 9.x |
>=9.0.0 <10.0.0 |
npm install @stackline/angular-highcharts@9.0.0 highcharts@10.3.3 --save-exact |
8.x |
Angular 8.x |
>=8.0.0 <9.0.0 |
npm install @stackline/angular-highcharts@8.0.0 highcharts --save-exact |
7.x |
Angular 7.x |
>=7.0.0 <8.0.0 |
npm install @stackline/angular-highcharts@7.0.0 highcharts --save-exact |
6.x |
Angular 6.x |
>=6.0.0 <7.0.0 |
npm install @stackline/angular-highcharts@6.0.0 highcharts --save-exact |
5.x |
Angular 5.x |
>=5.0.0 <6.0.0 |
npm install @stackline/angular-highcharts@5.0.0 highcharts --save-exact |
4.x |
Angular 4.x |
>=4.0.0 <5.0.0 |
npm install @stackline/angular-highcharts@4.0.0 highcharts --save-exact |
2.x |
Angular 2.x |
>=2.0.0 <3.0.0 |
npm install @stackline/angular-highcharts@2.0.0 highcharts --save-exact |
Angular 3 does not have a package family because Angular skipped version 3.
npm install @stackline/angular-highcharts highchartsThe package declares highcharts as a peer dependency so your application can choose the Highcharts version and modules it needs.
The Angular 22 validation app uses highcharts@13.0.1, which is the highest Highcharts version tested for this line.
The maintained Stackline Angular 22 line declares a Highcharts peer range of >=5.0.0 <=13.0.1 so applications get a clear, reproducible compatibility ceiling while still keeping Highcharts as an application-owned peer dependency.
Highcharts 13 does not change the wrapper API, but it includes upstream behavior changes that can affect application-owned chart options:
dataSortingnow requires thehighcharts/modules/data-sortingmodule.- Gauge and polar defaults changed, and some data-label positions can shift.
- Numeric solid-gauge radii are pixels; use strings such as
'50%'for percentages. useHTMLcontent is wrapped in adiv, so selectors targeting the oldspanwrapper may need adjustment.
import { NgModule } from '@angular/core';
import { BrowserModule } from '@angular/platform-browser';
import { ChartModule } from '@stackline/angular-highcharts';
import Highcharts from 'highcharts/esm/highcharts.js';

@NgModule({
  imports: [
    BrowserModule,
    ChartModule.forRoot(Highcharts)
  ]
})
export class AppModule {}<chart [options]="options"></chart>options = {
chart: { type: 'line' },
title: { text: 'Simple chart' },
xAxis: { categories: ['Jan', 'Feb', 'Mar', 'Apr'] },
yAxis: { title: { text: 'Revenue' } },
series: [
{ name: 'Orders', data: [29.9, 71.5, 106.4, 129.2] }
]
};Use the type input when the chart should be created with another Highcharts constructor.
<chart [type]="'StockChart'" [options]="stockOptions"></chart>stockOptions = {
rangeSelector: { selected: 1 },
title: { text: 'BNBUSDT candles' },
series: [
{
type: 'candlestick',
name: 'BNBUSDT',
data: []
}
]
};Common constructor values:
| Constructor | Usage |
|---|---|
Chart |
Default Highcharts charts. |
StockChart |
Highstock timelines, candlesticks, ranges, and financial charts. |
Map / mapChart style constructors |
Highmaps-style charts when the matching Highcharts build is registered. |
With Highcharts 13, import modules from the ESM build before registering the shared Highcharts instance. Older Highcharts factory modules can still be passed as additional ChartModule.forRoot(...) arguments.
import { NgModule } from '@angular/core';
import { BrowserModule } from '@angular/platform-browser';
import { ChartModule } from '@stackline/angular-highcharts';
import Highcharts from 'highcharts/esm/highcharts.js';
import 'highcharts/esm/highcharts-more.js';
import 'highcharts/esm/modules/solid-gauge.js';
import 'highcharts/esm/modules/heatmap.js';
import 'highcharts/esm/modules/data-sorting.js';
import 'highcharts/esm/modules/treemap.js';
import 'highcharts/esm/modules/funnel.js';

@NgModule({
  imports: [
    BrowserModule,
    ChartModule.forRoot(Highcharts)
  ]
})
export class AppModule {}
The live test matrix covers examples for line, spline, area, areaspline, column, bar, stacked column, pie, donut, scatter, bubble, combination, polar, gauge, solid gauge, heatmap, treemap, funnel, 3D column, StockChart, map-like charts, and no-data states.
The wrapper exposes Angular outputs for Highcharts chart, series, point, and axis event families.
<chart
  [options]="directiveOptions"
  (create)="onChartCreate($event)"
  (load)="record('chart load')"
  (redraw)="record('chart redraw')"
  (selection)="record('chart selection')"
>
  <series
    (click)="record('series click')"
    (legendItemClick)="record('legend click')"
  >
    <point
      (click)="record('point click')"
      (mouseOver)="record('point hover')"
    ></point>
  </series>

  <xAxis (setExtremes)="record('xAxis extremes')"></xAxis>
  <yAxis (setExtremes)="record('yAxis extremes')"></yAxis>
  <zAxis (afterSetExtremes)="record('zAxis extremes')"></zAxis>
  <colorAxis (setExtremes)="record('colorAxis extremes')"></colorAxis>
</chart>
events: string[] = [];
onChartCreate(chart: any) {
this.record('chart created with ' + chart.series.length + ' series');
}
record(message: string) {
this.events.unshift(new Date().toLocaleTimeString() + ' - ' + message);
this.events = this.events.slice(0, 8);
}Use (create) to keep the native Highcharts instance. This is the right path for realtime dashboards because it lets you update series progressively instead of recreating the full options object.
<chart [options]="options" (create)="saveChart($event)"></chart>chart: any;
saveChart(chart: any) {
this.chart = chart;
}
addPoint(value: number) {
if (!this.chart || !this.chart.series.length) {
return;
}
this.chart.series[0].addPoint(value, true, false);
}
replaceSeries(data: number[]) {
if (!this.chart || !this.chart.series.length) {
return;
}
this.chart.series[0].setData(data, true, false);
}Use normal Highcharts options. The wrapper does not invent a second chart configuration language.
columnOptions = {
  chart: { type: 'column' },
  title: { text: 'Monthly sales' },
  xAxis: { categories: ['Jan', 'Feb', 'Mar', 'Apr'] },
  yAxis: { title: { text: 'Sales' } },
  series: [
    { name: 'Online', data: [12, 18, 24, 31] },
    { name: 'Retail', data: [8, 13, 19, 22] }
  ]
};

pieOptions = {
  chart: { type: 'pie' },
  title: { text: 'Share by channel' },
  series: [
    {
      name: 'Share',
      data: [
        ['Organic', 42],
        ['Paid', 28],
        ['Referral', 18],
        ['Direct', 12]
      ]
    }
  ]
};For dashboards and live screens, keep the native chart instance from (create)
and update series data directly. This avoids recreating the full chart surface
on every frame.
updateCandles(ohlcData: any[], volumeData: any[]) {
  if (!this.chart) {
    return;
  }

  this.chart.series[0].setData(ohlcData, false, false);
  this.chart.series[1].setData(volumeData, false, false);
  this.chart.redraw();
}| Input | Type | Description |
|---|---|---|
options |
any |
Native Highcharts options object. |
type |
string |
Highcharts constructor name. Defaults to Chart. |
| Output | Description |
|---|---|
create |
Emits the native chart instance after creation. |
load, redraw, selection, click |
Chart-level Highcharts events. |
addSeries, afterPrint, beforePrint, drilldown, drillup |
Additional chart lifecycle and interaction events. |
| Directive | Events |
|---|---|
<series> |
Series event outputs such as click and legend interaction. |
<point> |
Point event outputs such as click, select, and mouse interaction. |
<xAxis>, <yAxis> |
Axis event outputs such as setExtremes and afterSetExtremes. |
<zAxis> |
3D / z-axis event outputs. |
<colorAxis> |
Heatmap, map, and color-scale event outputs. |
| Capability | Example |
|---|---|
| Options API | <chart [options]="options"> |
| Constructor switch | <chart [type]="'StockChart'" [options]="options"> |
| Directive events | <series>, <point>, <xAxis>, <yAxis>, <zAxis>, <colorAxis> |
| Highcharts modules | more, 3d, heatmap, data-sorting, treemap, funnel, solid-gauge, stock, map, drilldown, sankey, dependency-wheel, networkgraph, sunburst, wordcloud, xrange, timeline, variwide, variable-pie, item, streamgraph, bullet, dumbbell, lollipop, pareto, histogram-bellcurve, tilemap, venn, arc-diagram, organization, flowmap, geoheatmap, pictorial, contour, pointandfigure, renko |
The Stackline Angular wrapper is licensed under MIT. Highcharts is a separate peer dependency owned by Highsoft and is subject to the Highcharts license terms; consumers are responsible for an appropriate Highcharts license.