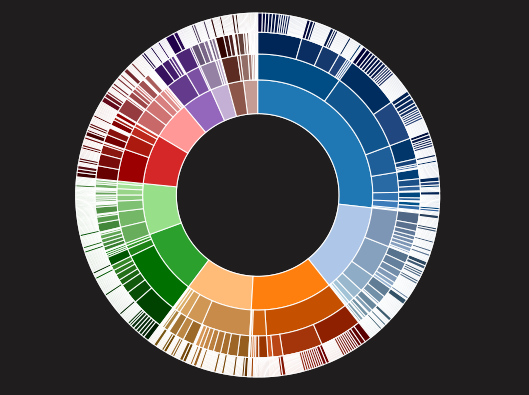
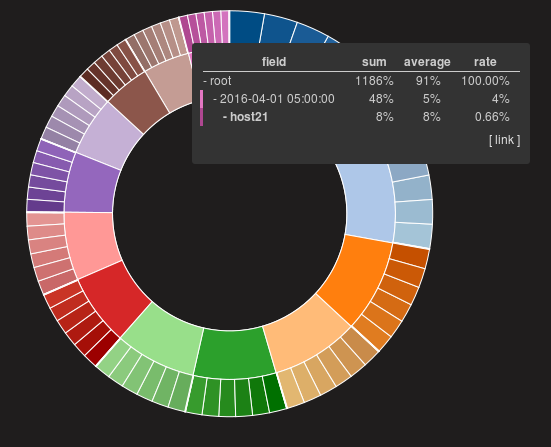
The sunburst panel is a multi-level pie chart. It can contain hierarchical data.
Tooltip is shown on mouse over of each arch node. Tooltip of a node shows information about same-leveled nodes and its child nodes.
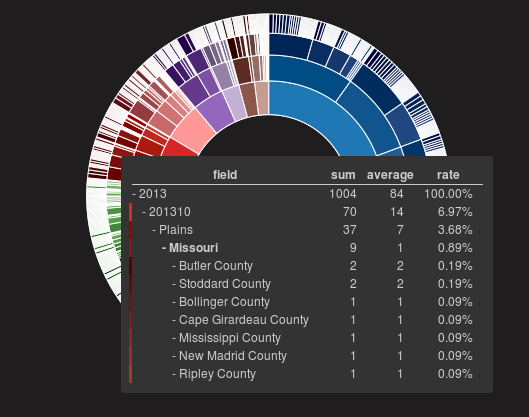
- sum
- The value of a node. If the node has children, the value of the node means sum of the values of its children.
- average
- If the node has children, the value of the node means average of the values of its children.
- rate
- The rate against the value of parent node.
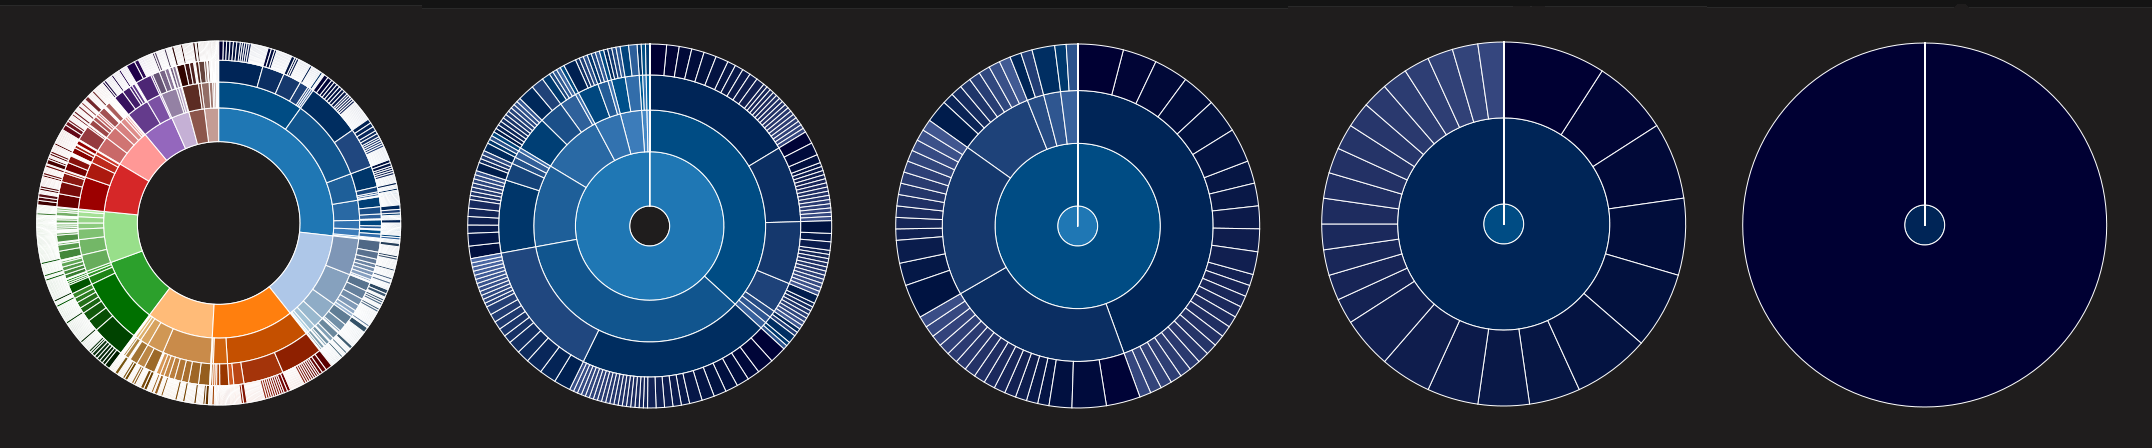
If you click an node in the graph, the graph transforms to zoom and show the child nodes.
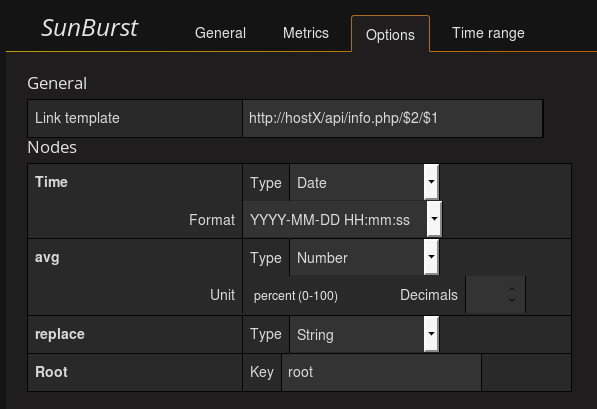
If link template isn't blank, tooltip contains a link with values of node and its ancectors. You can use $1, $2, $3 ... to add values to the link.
You can specify fields' types of a node.
- Number
- Add unit (%, $, bits/sec, ...)
- String
- Do nothing and just display.
- Date
- Convert numbers as unix timestamp to date text in specified format.
Ex.)
| Data source | TimeSeries | Table | Docs |
|---|---|---|---|
| ElasticSearch | OK | -- | OK |
| InfluxDB | OK | OK | -- |
| Sqldb (not released) | OK | OK | OK |
- Docs is the format returned by terms-aggregation in ElasticSearch.
Apache V2.0 License