An Exploratory Data Analysis (EDA) of six months of wearable health data to uncover relationships between lifestyle behaviors, physiological indicators, sleep quality, and stress levels.
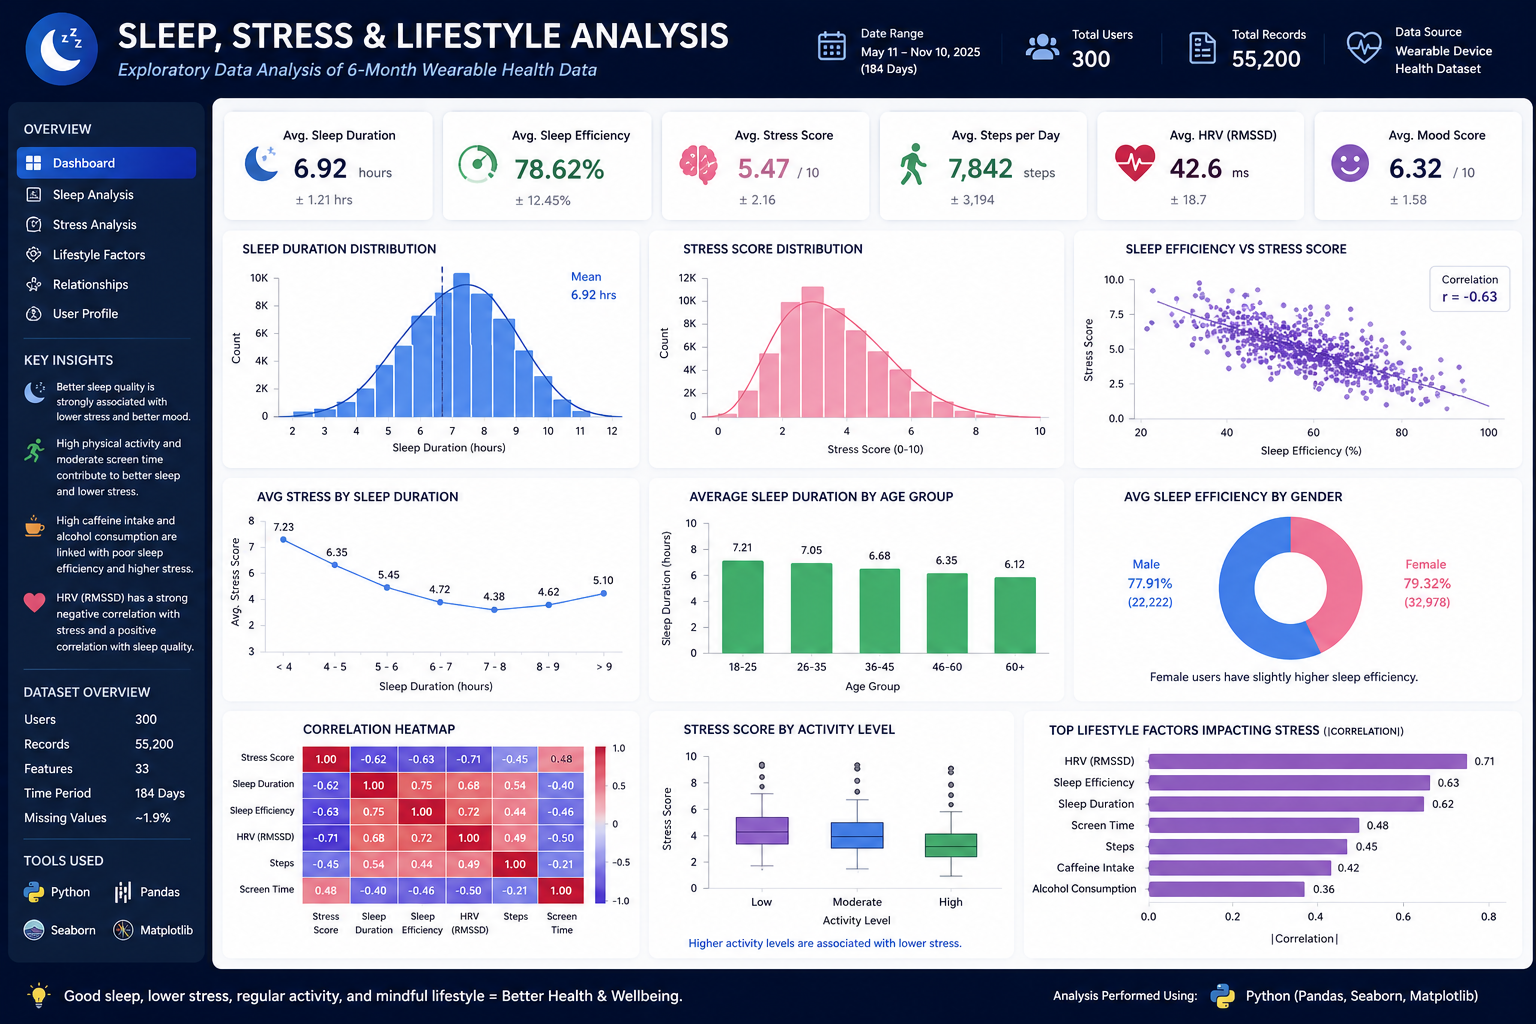
Wearable devices continuously generate large volumes of personal health data — yet most users never analyze it beyond their daily summary screen. This project performs a comprehensive EDA on six months of daily wearable health data from 300 users, investigating how everyday behaviors and physiological signals relate to sleep quality and stress.
This project investigates three key questions:
- Which lifestyle factors — caffeine, alcohol, screen time, physical activity — are associated with sleep quality and stress levels?
- How do physiological indicators (heart rate, HRV, SpO₂, blood pressure) vary in relation to sleep and stress?
- Are there noticeable differences in sleep and stress patterns across age groups, genders, and regions?
| Property | Details |
|---|---|
| Source | Kaggle — Health Wearables Stress & Sleep Tracking |
| Type | Synthetic wearable health dataset |
| Size | 55,200 records × 33 columns |
| Users | 300 unique individuals |
| Period | May 11 – November 10, 2025 (184 days) |
| Category | Description |
|---|---|
| Demographics | Age, gender, region, device model |
| Physiological Vitals | Heart rate, HRV, SpO₂, blood pressure |
| Sleep Metrics | Duration, efficiency, latency, WASO, sleep stages |
| Activity Metrics | Steps, distance, calories, workout details |
| Lifestyle Factors | Caffeine, alcohol, screen time, mindfulness |
| Subjective Well-being | Stress score, mood |
📓 Data_Analytics_Final_Project.ipynb
│
├── 1.  Introduction
├── 2.  Problem Statement
├── 3.  Objectives
├── 4.  Dataset Description
├── 5.  Data Loading and Initial Overview
├── 6.  Data Preprocessing
├── 7.  Exploratory Data Analysis (EDA)
│       ├── 7.1 Descriptive Statistics
│       ├── 7.2 Distribution Analysis
│       ├── 7.3 Relationship Analysis
│       └── 7.4 Key EDA Findings
├── 8.  Data Visualization
│       ├── 8.1 Univariate Visualizations
│       ├── 8.2 Bivariate Visualizations
│       └── 8.3 Multivariate Visualizations
├── 9.  Key Findings
├── 10. Conclusion
├── 11. Recommendations
├── 12. Limitations
├── 13. Future Scope
└── 14. References
| Tool | Purpose |
|---|---|
| Python | Core programming language |
| Pandas | Data manipulation and analysis |
| NumPy | Numerical operations |
| Matplotlib | Data visualization |
| Seaborn | Statistical visualizations |
| Google Colab | Development environment |
- Physical activity is the strongest behavioral predictor of stress — average stress score declines from ≈74 (Sedentary) to ≈61 (Highly Active)
- Sleep duration (-0.62) and HRV (-0.50) show the strongest moderate negative correlations with stress
- Caffeine, screen time, and alcohol show mild positive correlations with stress (0.26–0.31)
- Resting heart rate, SpO₂, and blood pressure show negligible relationships with stress (≤0.05)
- BMI has minimal influence on sleep efficiency across all BMI categories
- Demographic and regional differences are modest compared to behavioral and sleep-related factors
The project includes 15+ visualizations across univariate, bivariate, and multivariate analysis:
- Stress Score Distribution (Histogram)
- Sleep Duration Distribution (Histogram)
- Mood Distribution (Pie Chart)
- Activity Level Distribution (Bar Chart)
- Stress Score Trend Over 6 Months (Line Chart)
- Caffeine vs Sleep Efficiency (Scatter)
- Screen Time vs Sleep Latency (Scatter)
- Stress Score by Workout Type (Box Plot)
- Alcohol vs Sleep Efficiency (Scatter)
- Stress Score by Activity Level (Bar Chart)
- Sleep Efficiency by BMI Category (Bar Chart)
- Resting HR vs Stress Score (Scatter)
- HRV vs Stress Score (Scatter)
- Correlation Heatmap (Heatmap)
- Stress by Age Group and Gender (Bar Chart)
- Sleep Stage Composition (Pie Chart)
- Clone this repository
git clone https://github.com/bibythayyil/sleep-stress-lifestyle-analysis-python.git-
Open the notebook in Google Colab or Jupyter Notebook
-
Upload the dataset file:
wearables_health_6mo_daily.csv
- Run all cells in order (Runtime → Run All in Colab)
- This is observational, correlational data — findings represent associations, not causal relationships
- The dataset is synthetic and represents a simulated population; results may not reflect real-world patterns
- Data covers users from Turkey only, limiting geographic generalizability
- Missing values were handled with median imputation
- Formal statistical significance testing was not performed
- Apply hypothesis testing (t-tests, ANOVA) to confirm statistical significance of group differences
- Build predictive models to estimate stress or sleep quality from behavioral and physiological inputs
- Incorporate additional variables such as medical history, occupation, and socioeconomic factors
- Extend analysis to larger, more diverse, real-world wearable datasets
Bibin T S
Batch: DA-39
Data Analytics Capstone Project
Entri Elevate
This project is intended for educational purposes as part of a data analytics course capstone.