Select a token and view a few key metrics using FTX historical data at desired windows.
Available at CharlieDAO's R Shiny Apps Server.
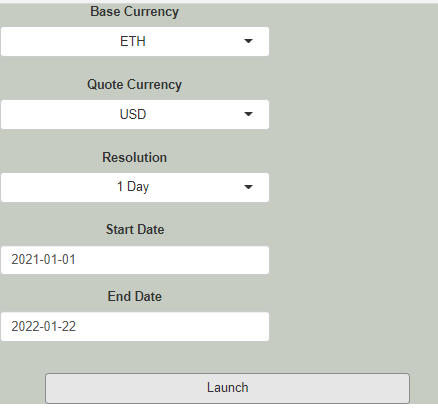
1/ Pick your poison.
Pick ANY Base Currency, Quote Currency, Resolution, Start Date, and End date that @FTX_Official provides.
(Note data goes back to 9/2019, ONLY 1500 resolution units are returned by the API, didn't feel like doing pagination).
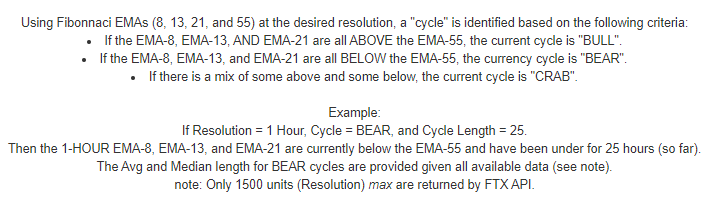
2/ Check out my new not_financial_advice algorithm.
If the EMA 8,13, and 21 are all ABOVE the EMA55, we are in a "BULL" (micro?)-cycle. If they are all BELOW, it's BEAR. Otherwise it's CRAB.
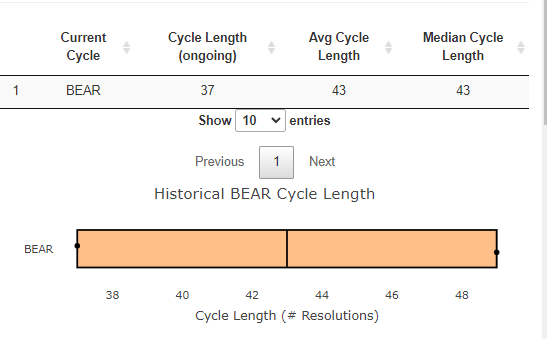
3/ Whatever asset-resolution-timeline cycle we're currently in, get a quick view of historical cycle lengths.
ETHUSD 1-Day is currently in a 37 Day BEAR cycle. Since Jan 1, 2021 the average BEAR cycle was 43 Days.
Not a forecast, but will things turn around next week? (note: based on 1/1/2021 - 1/22/2022 data).
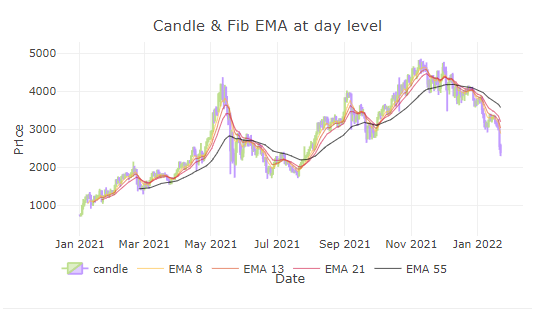
4/ Get the Candle chart with the Fib EMAs for your personal coping needs. You can click the legend to show/hide different elements in the chat, in addition to zoom-in, pan, reset, and download as an SVG.
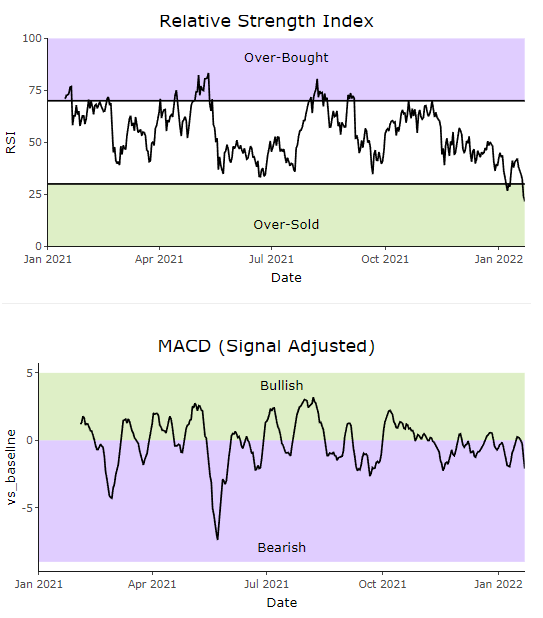
5/ Get the classic finance charts (lined up to the candle for interacting coping!).
RSI & MACD.
Purple = Bearish news, Green = Bullish news.
Not financial advice.
You can also zoom in, pan, and download as a PNG. You can refresh the page if you zoom and break something.
6/ You can look at your Asset-Resolution-Timeline (e.g. ETHUSD Daily since Jan 1, 2021) and see how long the historic NFA algorithm cycles lasted!
If you like this stuff or have suggestions/requests...
You can donate to my ENS and/or DM @charliedao_eth on Twitter to join the collective!