See which Vue components re-render — and why exactly.


Live demo → · Русский · 中文
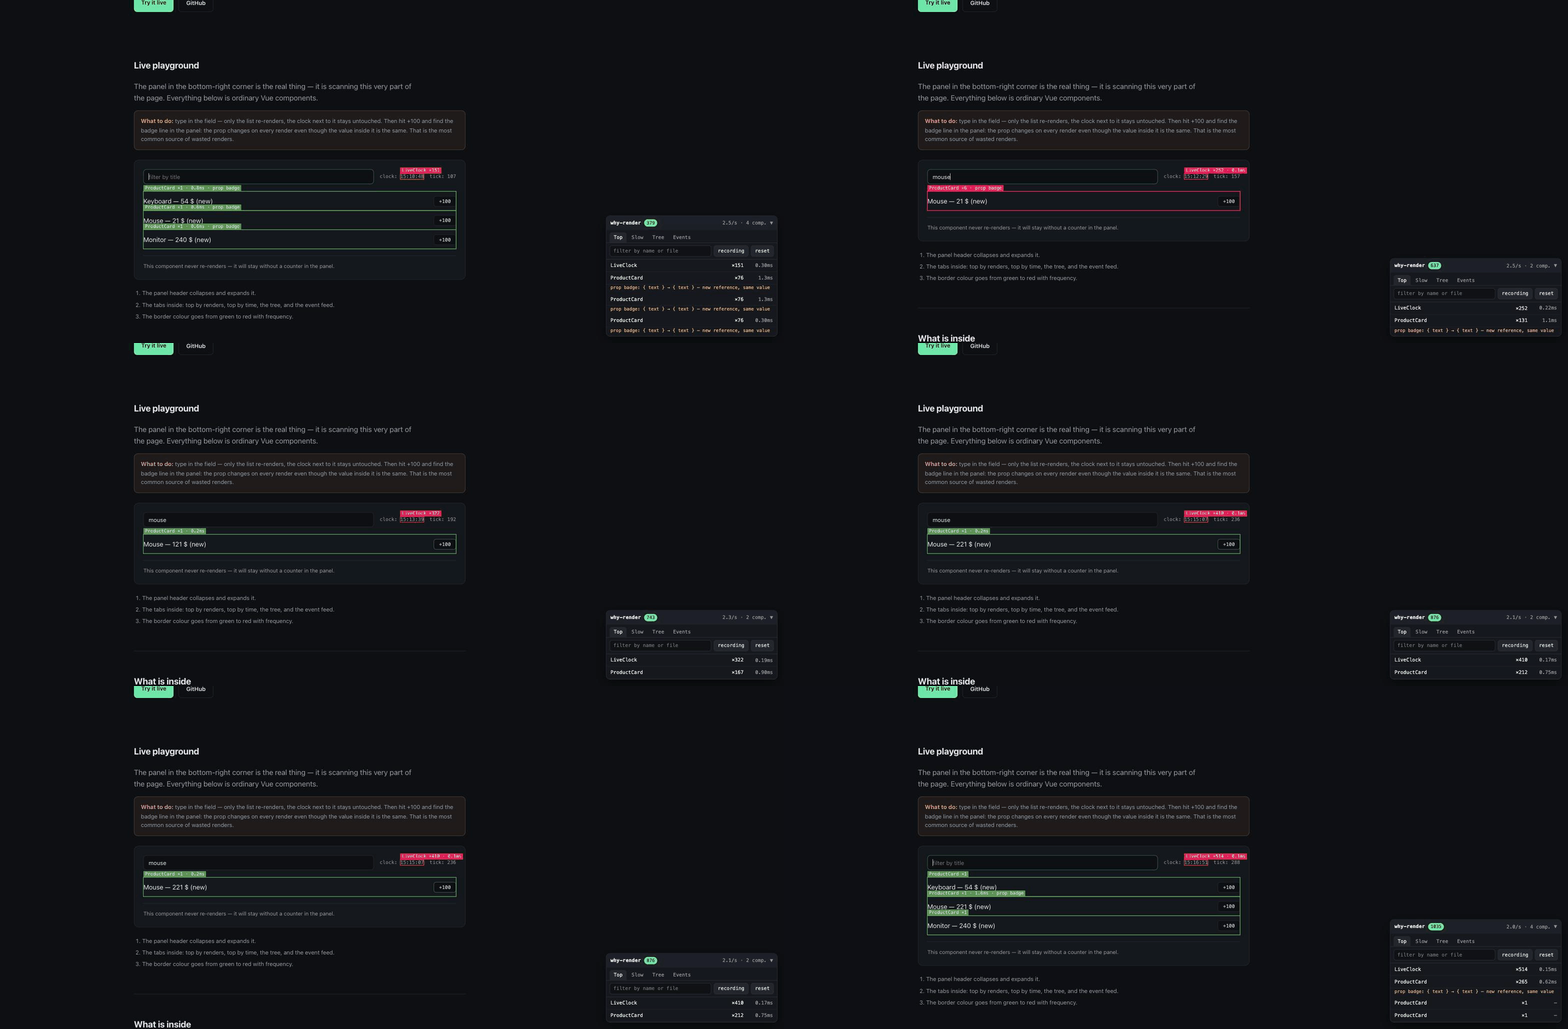
Other tools flash a border around a component that just updated. That is enough to
notice a problem, but not to fix it — you are still left asking what actually changed?
vue-why-render answers that: it names the exact reactive dependency that triggered
the render.
ProductCard ×7 · 2.4ms · badge
└─ prop badge: { text } → { text } — new reference, same value
In React you have to guess this by diffing props. Vue hands you the reason itself,
through the renderTriggered hook — this package is built around it.
- The reason, not just the fact: the name of the prop, ref, store key or array index, plus the old and new value.
- A dedicated "new reference, same value" verdict — by far the most common source of wasted renders.
- Overlay: a border around the re-rendered component, coloured from green to red by frequency.
- Panel: top by render count, top by time, a component tree with per-subtree totals, and an event feed.
- Jump to your editor: clicking a row opens the SFC in your IDE through the dev server.
- Pause, reset and filter by component name or file path.
- API:
getStats(),getEvents()and anonRendercallback, so you can build your own reports.
npm install -D vue-why-render
pnpm add -D vue-why-render
yarn add -D vue-why-render
bun add -d vue-why-render
Requires Vue 3.3+. The package has no runtime dependencies.
If installing from the registry is not an option, the tarball attached to every release installs from a direct link and needs no authentication:
npm i -D https://github.com/dadashi44/vue-why-render/releases/download/v0.1.8/vue-why-render-0.1.8.tgzimport { createApp } from 'vue'
import VueWhyRender from 'vue-why-render'
import App from './App.vue'
const app = createApp(App)
app.use(VueWhyRender, {
exclude: [/^RouterLink/, /^Transition/],
})
app.mount('#app')The plugin is client-only — a file with the .client.ts suffix never reaches SSR:
// plugins/why-render.client.ts
import VueWhyRender from 'vue-why-render'

export default defineNuxtPlugin((nuxtApp) => {
    nuxtApp.vueApp.use(VueWhyRender, {
        openInEditorUrl: '/__nuxt_devtools__/open-in-editor?file={file}',
    })
})import { scan } from 'vue-why-render'
const handle = scan(app, { panel: false })
handle?.pause()
handle?.getStats()
handle?.stop()| Option | Default | What it does |
|---|---|---|
enabled |
true |
Turns the scanner on. The package never guesses the build mode — see Cost. |
overlay |
true |
Borders around re-rendered components. |
panel |
true |
Floating statistics panel. |
showLabels |
true |
Component name label on the border. |
includeMounts |
false |
Report first mounts as well as updates. |
trackReasons |
true |
Collect reasons through renderTriggered. |
trackProps |
true |
Diff props between updates. |
include |
[] |
Watch only these components: a string, a regexp or a function. |
exclude |
[] |
Leave these components alone. Beats include. |
minDuration |
0 |
Ignore updates faster than this, in ms. |
hotThreshold |
5 |
How many renders per second count as "hot". |
maxEvents |
500 |
Size of the ring buffer of events. |
flushInterval |
250 |
How often the panel pulls a fresh snapshot, in ms. |
displayDuration |
600 |
How long a border stays visible, in ms. |
openInEditorUrl |
/__open-in-editor?file={file} |
Template for the open-in-editor link. |
locale |
'en' |
Panel language: en, ru or zh-CN. |
onRender |
— | Callback fired on every render event. |
A global mixin attaches renderTriggered to every component. Vue passes it
{ target, type, key, oldValue, newValue } — the object, the key, and the values before
and after. From there the package translates it into plain language:
target === instance.props→ a prop;- the target has an
$id→ a store (cart.items); - the target is a ref and the key is
value→ look up the variable name insetupStateand report state count instead of a uselessvalue; - an array →
[3]; aMaporSet→ a collection.
Independently of all that, props are diffed between consecutive updates. That is what catches the case where a parent hands down a freshly built literal every time.
This is a dev-only tool for three reasons, and none of them is an abundance of caution:
renderTriggeredonly fires in a development build of Vue — in production the hook is never called at all.- The callback runs on every reactivity trigger. If you are profiling timings specifically, set
trackReasons: false. - The global mixin adds hooks to every component in the application.
renderTracked — which fires on every read of a reactive value — is deliberately not
used: that is thousands of calls per second, and nothing left to profile.
Switching the scanner off in production is the caller's job. The package makes no
attempt to guess the build mode: process is not available in a browser bundle, and a
bare reference to process.env.NODE_ENV breaks the consuming application's production
build — @rollup/plugin-commonjs mistakes such an ESM file for mixed CommonJS and
rewrites it into syntactically broken code. So the scanner is simply on by default.
The right way is a static bundler flag, which strips both the call and the import itself:
// Nuxt
if (!import.meta.dev) return
const { default: VueWhyRender } = await import('vue-why-render')

// Vite
if (import.meta.env.DEV) {
    const { default: VueWhyRender } = await import('vue-why-render')
    app.use(VueWhyRender)
}Clicking a row in the panel asks the dev server to open the file. The package does
not pick the editor — that is done by launch-editor
on the Vite or Nuxt side, and by default it guesses.
The guess is VS Code. If the code command is not in your PATH you get this in the
terminal and nothing opens:
The editor process exited with an error: spawn code ENOENT
('code' command does not exist in 'PATH').
Name your editor explicitly — in the project .env, or in your shell profile to
cover every project at once:
LAUNCH_EDITOR=webstormRecognised values include code, cursor, webstorm, idea, phpstorm,
goland, rubymine, pycharm, sublime, atom, vim and emacs. The matching
CLI launcher has to exist — JetBrains IDEs install theirs through Toolbox, VS Code
through Shell Command: Install 'code' command in PATH.
Restart the dev server afterwards.
The endpoint itself is found automatically: the package tries the configured
openInEditorUrl, then Vite's /__open-in-editor, then Nuxt's
/__nuxt_devtools__/open-in-editor. If none of them answers, it prints a hint to
the browser console once per session.
- It does not replace Vue DevTools flame graphs or browser traces: it shows what re-rendered and why, not where the time went inside a render.
- It does not work in production.
- It does not support Vue 2.
npm install
npm run dev        # playground with demo components
npm run dev:site   # landing page with the same playground inside
npm run build:site # build the site into dist-site
npm test           # vitest
npm run test:coverage
npm run typecheck  # vue-tsc
npm run lint
npm run build
Tests mount real Vue applications in jsdom and cover the whole path: from a ref changing
to the registry recording it with the correct reason. The overlay is verified against a
stubbed 2d context, the panel through @vue/test-utils.
CI runs lint, types and tests on Node 20/22/24, separately verifies installation and building under pnpm, yarn and bun, and then installs the packed tarball into a clean project with each of the four managers, exercising both the ESM and the CJS entry point.
Releases go to npm on a v* tag through trusted publishing: there are no tokens in
repository secrets — npm exchanges the Actions OIDC token for one-time credentials and
attaches provenance itself.
MIT