
A firm of financial analysts, built from agents. Six analyst agents each cover one part of a company's own SEC filings (financial performance, accounting quality, capital allocation, this year's new risk factors, management's guidance, segments), and every number they quote is checked against the filing in code. Code then values the company and rates it, a red team on a different model family argues the other side, and the firm hands back a first-pass memo for any US-listed company in about 40 seconds and one cent: the evidence, a sourced valuation, a rating a person can recompute, and the points where it could be wrong.
Agents read and quote; code checks and calculates. Glass because every step is open to inspection: each claim carries its quote and passage, each valuation input its source, each rating its arithmetic.
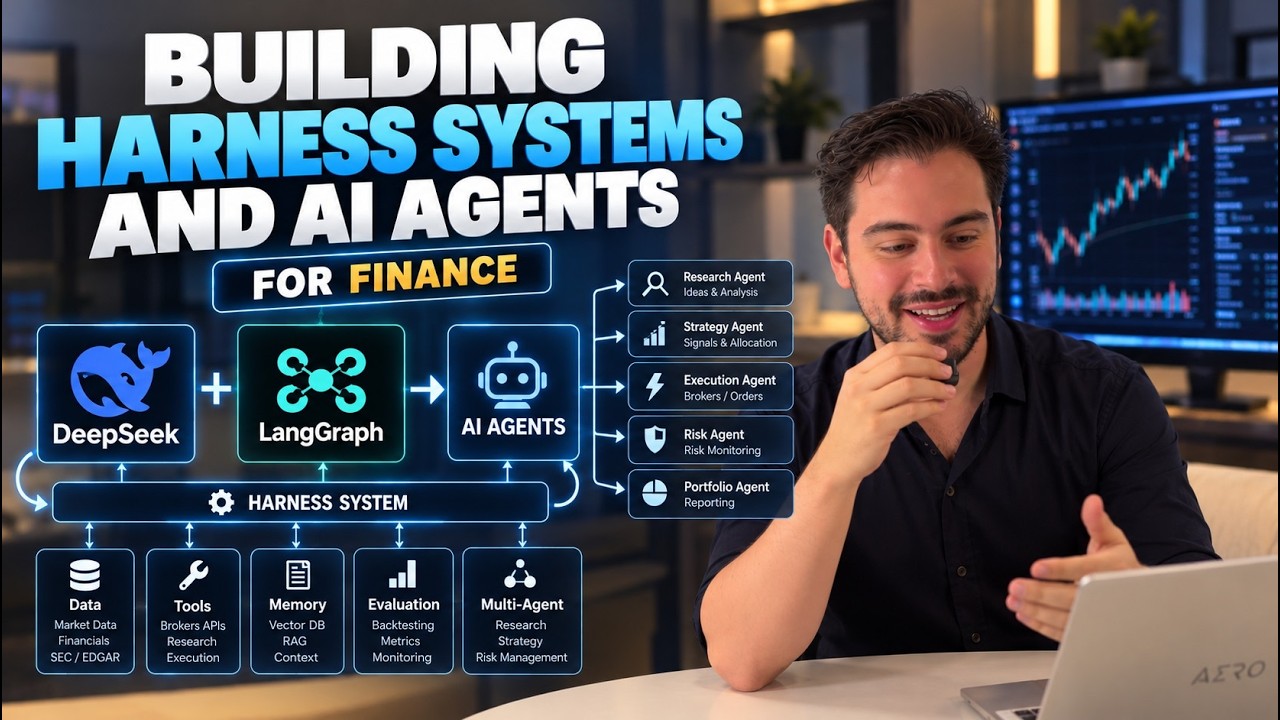
Video walkthrough: Build Your Own AI Finance Agents with LangGraph, from a plain LLM test to a paper order, with the code behind each step.
LLM trading agents give a rating you cannot check, cannot afford at scale and cannot trust twice:
- Unverifiable. In our Glassbench runs of TradingAgents, only 25 of 35 valuation multiples the agents quoted matched the true figure, and without served valuation data the reports stated it was missing 55 times in 12 runs.
- Unstable. Two TradingAgents runs on Microsoft, same inputs, started two minutes apart, returned Underweight and Overweight.
- Expensive. A full TradingAgents run costs about $0.06, 320,000 tokens and 8 minutes per stock and date.
- Opaque. The rating comes from a language model's judgment, so no one can say which assumption drove it.
An analyst screening a watchlist needs the opposite: numbers traced to the filing, a valuation whose every input has a source, a rating rule that is arithmetic, a measure of how much the answer moves on a rerun, and the cheapest possible cost per company.
For each company:
-
Six readers (DeepSeek Flash with bounded tasks) search the latest 10-K, 10-Q and earnings release and return structured claims with the exact quote and passage ID: financial performance, accounting quality, capital allocation, the risk factors that are new this year, management's guidance (as ranges) and segment revenue and operating income (this year and last).
-
Code checks every claim against the filing: the quote must be in the cited passage and every number in the quote (a range's two ends, last year's figure).
-
Verified claims move the valuation (
forward.py): a full-year revenue outlook, set against last year's revenue from XBRL, moves starting growth halfway toward the guided midpoint (at most 5 points); the segment mix in five years (each segment at its own growth and margin) sets a target margin the DCF converges to by year 5. -
Code values the company, with the model picked by its SEC industry code:
- operating companies: FCFF DCF at its own WACC (bottom-up beta, implied ERP paired with its risk-free rate, synthetic-rating cost of debt), stock-based compensation expensed, R&D capitalized where material, leases as debt, growth paid for by reinvestment, a moat share taken from 5-year ROIC history, and a reverse DCF;
- banks and insurers: excess return model on a normalized 5-year ROE, with at most half of today's excess return kept in the terminal value, at a cost of equity no lower than the rate at which the same model prices the industry's book at its own P/B (CAPM on insurers' low betas gave 7.4% against 9.4 to 9.9% implied);
- utilities: earnings grow with the rate base (median of net plant and EPS growth, 0 to 7%), dividends = earnings x a payout moving to 1 - g / ROE;
- REITs: two-stage dividend discount model on their own dividend per share growth.
Starting growth blends the last twelve months with the 3-year CAGR. The memo states what must be true: the constant operating margin the price needs, against the company's own 10-year range. A second method checks the first: industry EV/EBIT (price to book adjusted for ROE for financials) from Damodaran's January 2026 tables; when the two disagree by more than half, uncertainty goes up a level.
-
Code rates it: price over base fair value against Morningstar-style bands that widen with uncertainty, minus notches for flags raised by verified evidence (material weakness, weak cash conversion, a large share of new risk factors).
-
A red team on a different model family (Gemini 3.1 Flash-Lite) argues against the rating using only the verified evidence, starting where code points it: the input that moves fair value most and the margin the price needs. A correction must be a formula over claim IDs (operating income / revenue, revenue / prior revenue - 1); code computes it, checks that it computes what it claims and that a margin stays within 30% of the reported one, then revalues, one notch at most. Criticism of the method goes to a review list and never moves a rating.
-
A noise meter runs the red team three times and reports the median rating and the agreement.
-
An audit recomputes each memo (value, equity bridge, WACC, scenario order, share of claims verified) and the batch's median price to fair value.
-
A memo in Markdown per company: rating and why, valuation build-up, sensitivity grid, evidence with quotes, red team, noise, data notes, parameters, cost.
Thirteen large caps plus two REITs, two utilities and four insurers, so every valuation route ran (final version of the day).
| Measure | Result |
|---|---|
| Claims checked against the filings | 828 of 839 (the code verifier rejected 11) |
| Audit | 21 of 21 memos add up |
| Median price / fair value | 1.18 (the financials' industry-implied cost of equity made banks and insurers dearer) |
| Forward drivers used | guidance moved starting growth on 5 companies, segment mix set a margin path on 7 |
| Red team | 63 runs; 3 moved a rating, and all 3 fail the formula rule tightened afterwards (an invented constant, a revenue share sent as growth) |
| Agreement across 3 repeats | 100% on 19 companies, 67% on 2 (100% on 20 under the tightened rule) |
| Cost per company | about $0.008 of DeepSeek for the readers; the red team runs on Gemini's free tier (the ledger prices it at the paid rate, $0.015 a company in all) |
| Time per company | about 58 seconds |
| Rating | Companies |
|---|---|
| Buy | Meta, Realty Income |
| Overweight | Visa, Prologis, NextEra |
| Hold | Microsoft, Alphabet, Duke Energy (Nvidia, Hold in the run, is Underweight under the tightened rule) |
| Underweight | Apple, JPMorgan, Walmart, Pfizer, Caterpillar, Bank of America, Chubb |
| Sell | Amazon, Coca-Cola, Progressive, Travelers, MetLife |
They are valuation opinions under the stated parameters, not return forecasts (see the backtest below) and not investment advice.
backtest.py replays the valuation and the rating (no model calls, so nothing remembered from the future) on the last trading day of every month for each current S&P 500 member from the day it joined: XBRL facts filed before that day, that day's close, betas and volatility from prices up to it, Damodaran's implied ERP and T-bond rate from the previous year end, and his January industry EV/EBIT, P/B and P/E tables of that year.
| Signal (481 companies, 129 months) | 1-month rank IC | t | 12-month rank IC | t |
|---|---|---|---|---|
| fair value / price (desk) | +0.004 | 0.4 | +0.025 | 1.1 |
| rating (desk) | +0.000 | 0.0 | +0.018 | 0.8 |
| industry multiples value / price | +0.005 | 0.5 | +0.024 | 2.3 |
| book-to-market | -0.005 | -0.3 | -0.016 | -0.3 |
| EBIT / EV | +0.001 | 0.1 | -0.001 | -0.0 |
The ratings do not sort later returns: 12-month excess return over the universe average was Buy -1.5%, Overweight +0.4%, Hold 0.0%, Underweight -1.3%, Sell -2.2%. The desk's fair value / price moves with EBIT / EV (rank correlation 0.80): it is largely a value measure, and value lost in 2016 to 2020 (IC -0.021) and won in 2021 to 2025 (+0.083). Within an industry it has a weak short-horizon signal (1-month IC +0.031, t 3.8). Banks show a strong one (+0.175), which survivorship most likely inflates: banks that failed in 2023 are not in today's member list.
A lesson from building it: with the January 2026 industry tables applied to every year, the industry multiples signal looked strong (12-month IC +0.082, t 4.5). With each year's own tables it fell to +0.024. Industries that re-rated by 2026 looked cheap in the past because their future multiple was used.
Leaks left: industry betas and rating spreads are the 2026 vintage; SIC codes and industry mapping are today's; companies that left the index are missing. The readers and the red team cannot be backtested, since they read today's filings; their effect is measured by the forward track record only.
One question: does the model layer (readers, forward drivers, red team, noise meter) add anything over the code-only valuation? data/universe.csv fixes 50 US large caps across all eleven sectors, the 21 names rated on 2026-10-01 first, with banks, insurers, utilities and REITs on every valuation route. python desk.py --universe rates them twice on the same day, code first (--valuation-only, no model call), then the full desk, and records both in data/track_record.csv with two columns: variant (code or full) and model_snapshot. DeepSeek's API answers with the alias deepseek-flash only, so the snapshot is declared in track.SNAPSHOTS (deepseek-v4.1-flash-1017 since 2026-10-17), and an alias move starts a new series. Rows recorded before 2026-10-19 read as full, snapshot deepseek-v4.1-flash-0910 (V4.1 Flash as served before the 17 October update).
python track.py score reports each series (variant and snapshot) at 90, 180 and 365 days: the equal-weight excess return over SPY of Buy and Overweight minus that of Underweight and Sell, hit counts, the split by rating day, and each full series against the code ratings of the same companies on the same days. Nothing is due before 2026-12-29.
| First batch, 2026-10-19, off-peak | code | full |
|---|---|---|
| Rated and recorded | 49 of 50 (American Tower: dividend or share history missing from XBRL) | 27 (the $0.40 ledger cap was reached during Verizon, whose memo is kept but not recorded) |
| Time | 83 s | 1,087 s, 35 s median a company |
| Model use | none | 454 calls, 1.98 million tokens; 30% of DeepSeek input served from cache |
| Ledger | $0 | $0.401: DeepSeek $0.204, Gemini red team $0.196 at the paid rate (it ran on the free tier) |
| DeepSeek at V4.1 Flash off-peak list prices ($0.15 cache miss, $0.003 hit, $0.60 output per million; the ledger charges $0.14 on every input token and $0.28 output) | $0 | $0.214 |
| Audit | 50 of 50 | 26 of 28 (Coca-Cola and Chubb: segment table rows the verifier rejects) |
| Full rating differs from code | 4 of 27: Pfizer and Cisco one notch up (guidance growth), Oracle one down (new risk factor share), Prologis two down (a false red flag, below) |
Against 2026-10-01 on the 21 shared names, 6 final ratings changed. Price moves alone account for 5 (Apple, Walmart, Chubb down a notch, Bank of America up, Realty Income down): the 2026-10-01 fair value at today's price gives the same code rating as today's run on 20 of 21. The sixth is Prologis, Overweight to Underweight: the new snapshot quoted a different internal control sentence ("no significant changes ... corrective actions with regard to significant deficiencies and material weaknesses"), which the red flag pattern reads as a weakness. Every forward driver came out with the same numbers on both dates. Claims checked 812 of 830 against 828 of 839; red team moves 0 of 63 against 3 of 63 (all three fail the formula rule added after that run, which also rejected all 15 corrections proposed today on the 27 names). Readers' tokens served from cache fell from 59% to 27% of the total.
python desk.py --tickers MSFT,AAPL --budget-usd 0.50       # full desk, memos in runs/memos/
python desk.py --tickers MSFT --valuation-only             # free: SEC, FRED and Yahoo only
python desk.py --universe --budget-usd 0.50                # forward test: data/universe.csv, code-only pass then full desk
python desk.py --universe --variants code                  # forward test, the free code-only pass alone
python backtest.py fetch && python backtest.py run          # free: point-in-time replay of the code core
python run.py --tickers MSFT --readers performance         # one reader, for testing
python track.py show                                       # ratings recorded, with variant and model snapshot
python track.py score                                      # long-short excess return vs SPY at 90, 180, 365 days, by variant
python -m pytest tests/unit_tests                           # offline tests, no key, no cost
Every run appends its ratings to data/track_record.csv with its variant (code for --valuation-only, full for the desk) and the readers' model snapshot. They are scored later against SPY, so the track record builds forward, without a backtest and without the look-ahead a backtest on today's filings would carry.
Glassbench (the local run viewer next to TradingAgents and AI Hedge Fund) drives the same Desk.company() through its own driver and shows each reader, the valuation, the red team and the noise meter as lanes on the run page.
Keys come from Agents_model/.env through FIDCS/backend/chaves.py (DeepSeek, FRED, SEC contact email) and are never printed. Every model call prints a line; each run stops at --max-tokens and each batch at --budget-usd.
src/fundamentalist/parameters.py holds each parameter with its value, method, source, alternatives and whether it was verified on a primary source: risk-free rate and ERP pairing (Damodaran, 2026-09-01), beta method, rating spreads (January 2026), tax, growth bounds and base-rate decay, terminal growth, moat rule, R&D lives, captive finance, sanity bounds, rating bands. The memo prints them; the red team cites them by name in its method review. The docstrings record the versions that were rejected and why (a plain DCF that rated every large cap a Sell; a 3.5% terminal cap that made the model bearish by construction).
- Operating margin is held at today's level; margin expansion enters only through a red team correction backed by evidence (Amazon's technology spending sits under a company tag the XBRL API does not carry, so it is not capitalized).
- The rating is a valuation opinion, not a return forecast: in the 2015 to 2025 backtest it did not sort later returns.
- Guidance moves only starting growth, and only when stated for a full year or as a growth rate; no analyst consensus.
- Pharma pipelines are not valued; banks and insurers use an excess return model without a separate look at reserves or credit losses.
- The readers read the latest filings, so the desk runs live only.
- Ratings are not backtested; the forward track record needs months before it says anything.
Started from LangChain's data-enrichment LangGraph template (MIT, see LICENSE-langchain-template and NOTICE); its agent loop remains, everything else is new. Market data: SEC EDGAR, FRED, Yahoo Finance. Valuation datasets: Aswath Damodaran (industry betas, rating spreads, implied ERP, R&D lives, company industries), saved in data/ with their dates.