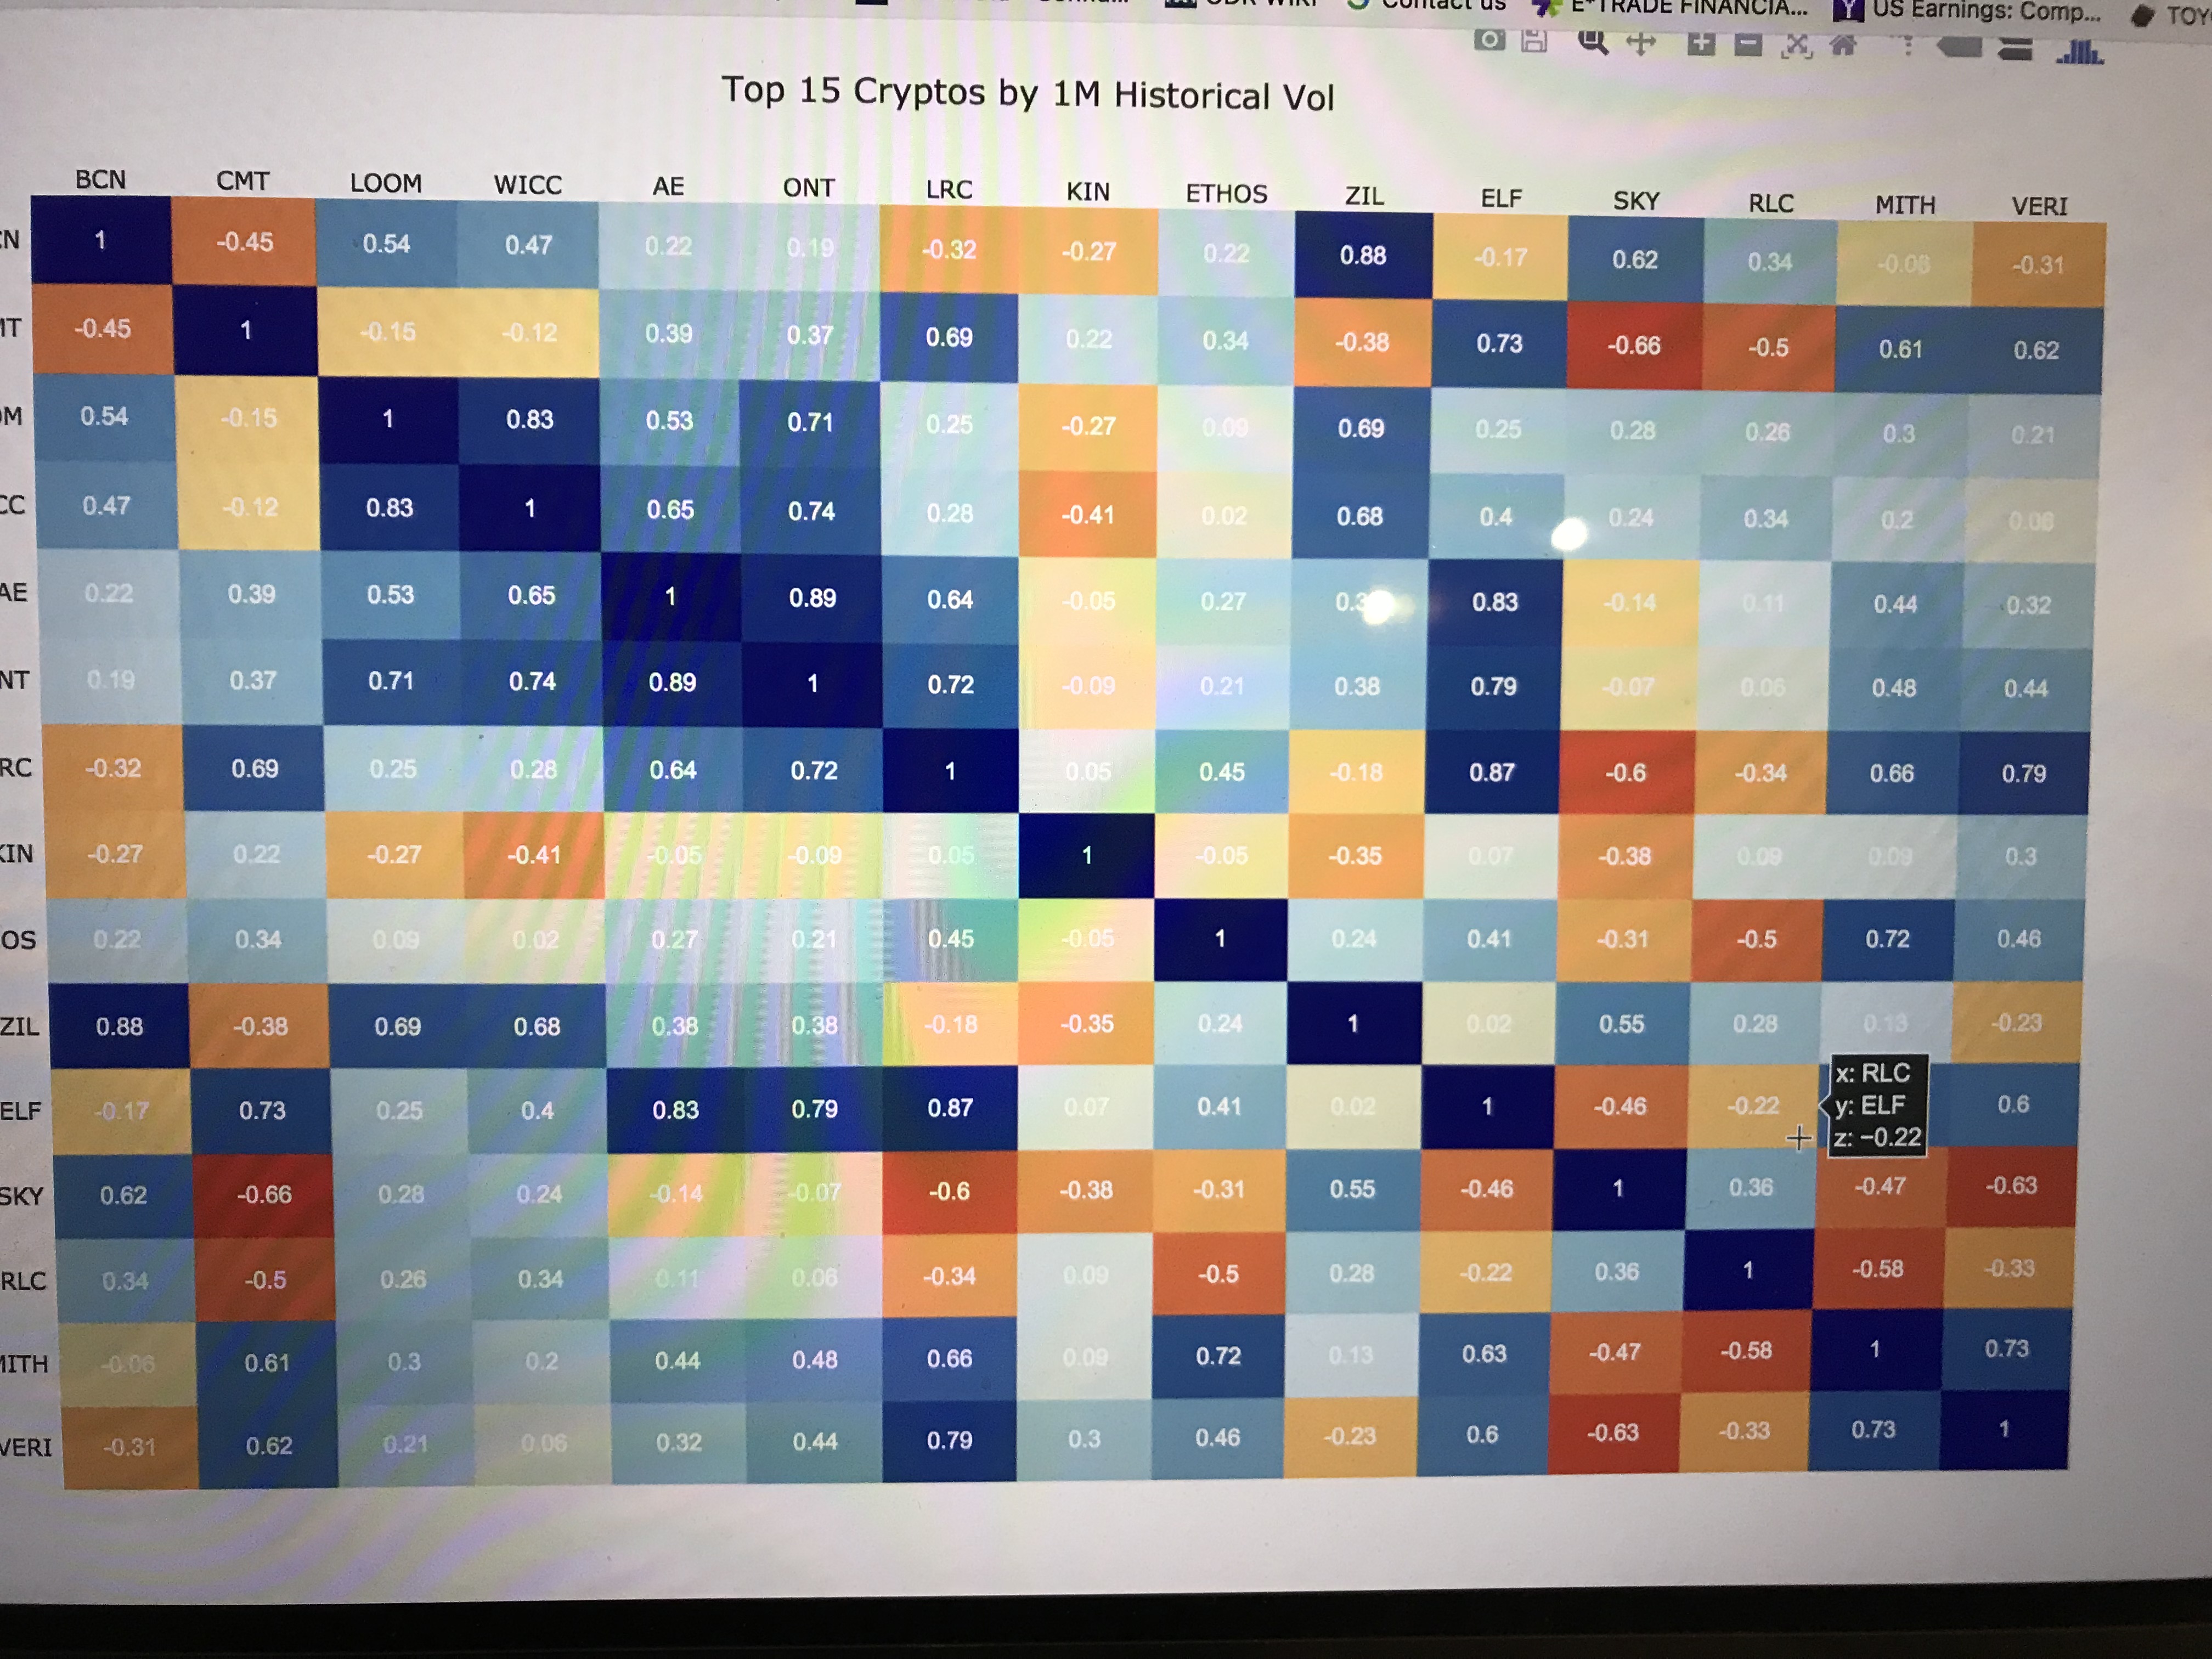
The application would show the correlation matrix of the top 15 currencies by volume in 2 periods: oct-dec 2017 and jan-apr 2018 for the viewer to analyze.
The application uses Angular framework for the front end with Plotly.js for Charting and has a python based restful service which provide the data to the model. It also has a backend job written in python which collects historical data for 100 crypto currencies for 2 years and stores it in Mongo database. Care has been taken to ensure that backend job runs within a few seconds and uses Thread pool for peformance.
Summary : Angular 4 / Plotly.js for Web application
          Python / Flask for Rest
          Python / Mongo for backend job and persistence.
  Two distinct analysis was performed
    1. Top 15 Cryptos with High Market Capitilzation to see correlation patterns among them in a nicely fashined Grid
    2. Computed 1M Historical Volatility for all 100 Cryptos and found the 15 most volatile to analyse correlation among them.
- git clone https://github.com/delagroove/finale_602
- docker pull mkunissery/web
- docker pull mkunissery/backendjob
- docker pull mkunissery/teampapp
- docker-compose up [takes about 3-4 mins, loads 3 different services ]
- once container is loaded open http://0.0.0.0:4200