Hello! I'm running Timebase Administrator v.1.0.4 using Docker image epam/timebase-ws-server:1.0.4 and Timebase server from the image finos/timebase-ce-server:6.1. I've initialized the server with some test data, as it described here.
I've noticed that in some cases, when I'm making a mistake in my queries, I'm not getting any error messages in web UI. For example, in a case of the following request:
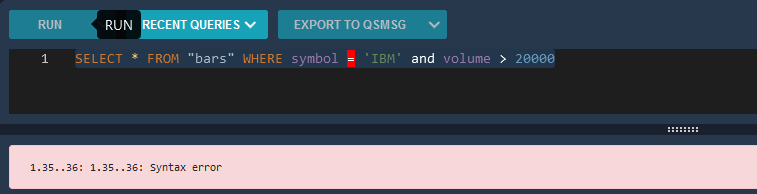
SELECT * FROM "bars" WHERE symbol = 'IBM' and volume > 20000
I'm getting an error message "1.35..36: 1.35..36: Syntax error"
At the same time, I'm not getting anything for the next request:
SELECT count(*) FROM "bars" WHERE symbol == 'IBM' and volume > 20000
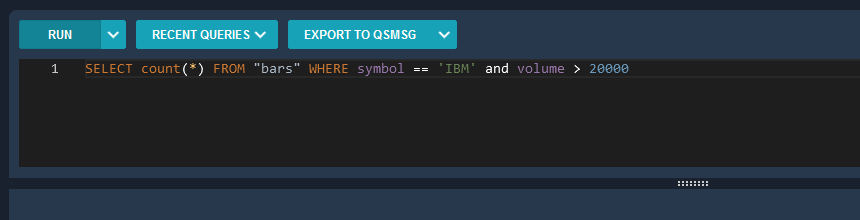
Meanwhile, there is a couple of 500 errors in browser's web console, but UI doesn't produce any error messages for them.
Please, check HAR file attached.

Hello! I'm running Timebase Administrator v.1.0.4 using Docker image epam/timebase-ws-server:1.0.4 and Timebase server from the image finos/timebase-ce-server:6.1. I've initialized the server with some test data, as it described here.
I've noticed that in some cases, when I'm making a mistake in my queries, I'm not getting any error messages in web UI. For example, in a case of the following request:
SELECT * FROM "bars" WHERE symbol = 'IBM' and volume > 20000I'm getting an error message "1.35..36: 1.35..36: Syntax error"
At the same time, I'm not getting anything for the next request:
SELECT count(*) FROM "bars" WHERE symbol == 'IBM' and volume > 20000Meanwhile, there is a couple of 500 errors in browser's web console, but UI doesn't produce any error messages for them.
Please, check HAR file attached.