gpngr is a cross-platform ping graphing tool. It sends raw ICMP echo requests and renders live RTT graphs — one per host — in a resizable window.
Inspired by https://github.com/bp2008/pingtracer
Looking for a terminal-based variant instead? See pngr.
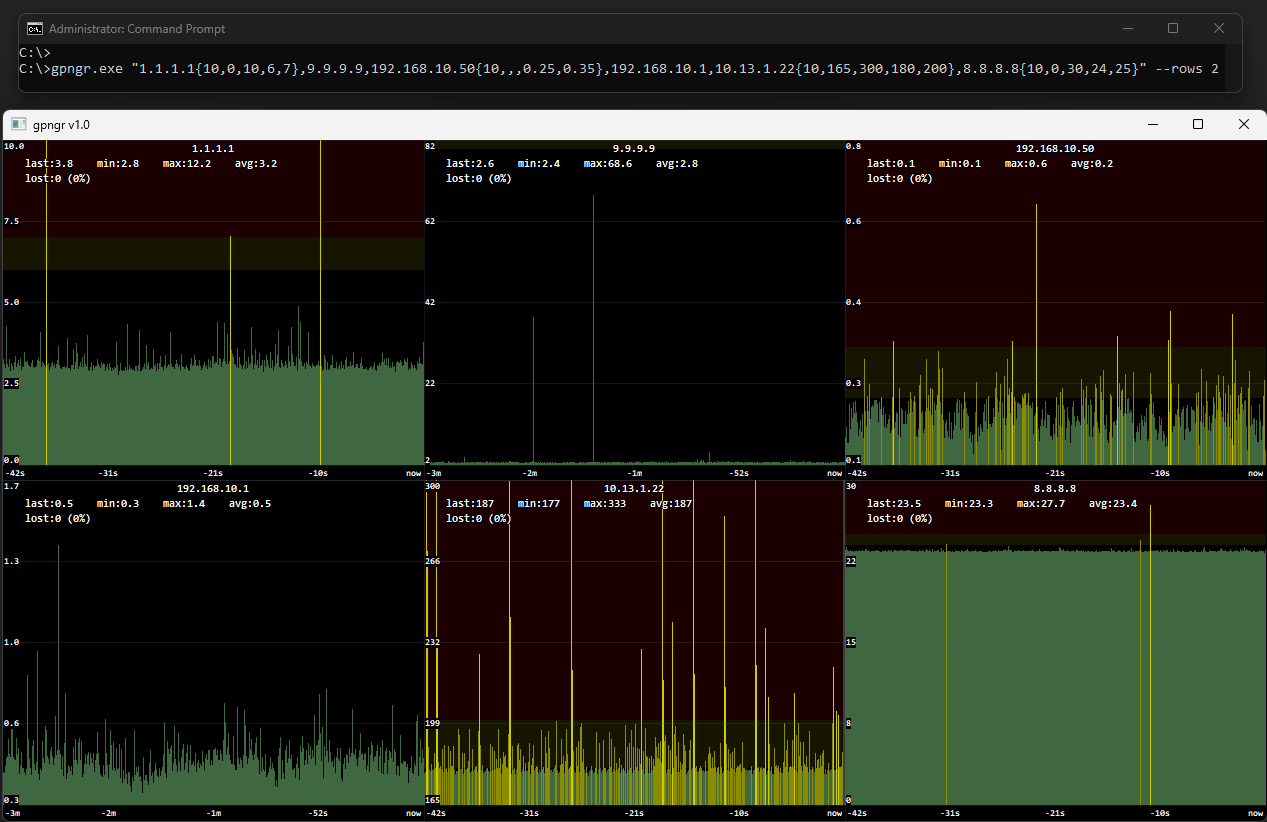
- Live RTT graph per host, one pixel column per sample
- Colour-coded bars: good / warn / bad / loss, with configurable thresholds
- Auto-scaling Y axis, or fixed range per host
- Configurable ping rate and sample history per host
- Multi-host grid layout (auto or forced rows/cols)
- Double-click any cell to zoom in; double-click again to return
- Fullscreen mode (F / F11); Q or Escape to quit
- Debounced ring resize on window resize — history is preserved
- Focused graphs retain their full history when zoomed
- Time axis labels (now → −Xs → −Xm → −Xh)
- Live stats overlay: last / min / max / avg / loss%
- Unprivileged ICMP on Linux and macOS (no root required on modern distros)
- Single-file C source, no external libraries beyond X11/Xft on Linux
gcc -O2 -o gpngr.exe gpngr.c -lws2_32 -lwinmm -lgdi32 -luser32 -lmsimg32 -mwindows
gcc -O2 -o gpngr gpngr.c -lm -lpthread -lrt -lX11 -lXext -lXft
On most modern distros, unprivileged ICMP works out of the box. If you get a socket error, either run as root or widen the ping group range:
echo "0 2147483647" | sudo tee /proc/sys/net/ipv4/ping_group_range
gcc -O2 -o gpngr gpngr.c -lm -lpthread -lX11 -lXext -lXft
Requires XQuartz for X11 support.
Pre-built static binaries for all platforms are available on the Releases page.
gpngr [options] "host1{params},host2{params},..."
Each host can optionally be followed by {rate,ymin,ymax,warn,bad,samples}. All fields are optional — leave blank or use auto to use the default.
| Parameter | Description | Default |
|---|---|---|
rate |
Pings per second | 2 |
ymin |
Y-axis minimum in ms | auto |
ymax |
Y-axis maximum in ms | auto |
warn |
RTT warn threshold in ms | 80 |
bad |
RTT bad threshold in ms | 150 |
samples |
Max samples to store — integer count or time string (30s, 5m, 1h, 2d) |
auto (graph pixel width) |
When samples is a time string, the count is calculated as rate × duration.
When samples is auto, the ring resizes with the window so one sample = one pixel column.
| Flag | Description |
|---|---|
--rows N |
Force N rows in the grid layout |
--cols N |
Force N columns in the grid layout |
--width N |
Initial window width (default: 1280) |
--height N |
Initial window height (default: 720) |
--full / --fullscreen |
Start in fullscreen mode |
--display N |
Open on monitor N, 0-based (Windows only) |
--version |
Print version and exit |
--help / -h |
Show help |
| Input | Action |
|---|---|
| Double-click | Zoom into / out of a single graph |
| F / F11 | Toggle fullscreen |
| Escape | Exit zoom → exit fullscreen → quit |
| Q | Quit immediately |
# Two hosts, auto layout
gpngr "8.8.8.8,1.1.1.1"

# Four hosts, forced 2×2 grid
gpngr --rows 2 --cols 2 "8.8.8.8,1.1.1.1,9.9.9.9,208.67.222.222"

# Custom rate, thresholds, and 1 hour of history
gpngr "8.8.8.8{1,,,,50,100,1h},1.1.1.1"

# Fixed Y axis, 5 pings/sec, warn at 20ms, bad at 50ms
gpngr "10.0.0.1{5,0,100,20,50}"| Colour | Meaning |
|---|---|
| Green | RTT below warn threshold |
| Yellow | RTT between warn and bad thresholds |
| Bright yellow | RTT above bad threshold |
| Red | Packet lost |
| Dark grey | Packet in flight (pending) |
MIT License. See LICENSE for details.
Pull requests, forks, issues and suggestions are all welcome.
If gpngr has been useful to you, consider buying me a coffee:
PayPal:
BTC: 1Q4QkBn2Rx4hxFBgHEwRJXYHJjtfusnYfy
XMR: 4AfeGxGR4JqDxwVGWPTZHtX5QnQ3dTzwzMWLBFvysa6FTpTbz8Juqs25XuysVfowQoSYGdMESqnvrEQ969nR9Q7mEgpA5Zm

