Home
GridSuite is a set of apps to run and study power systems.
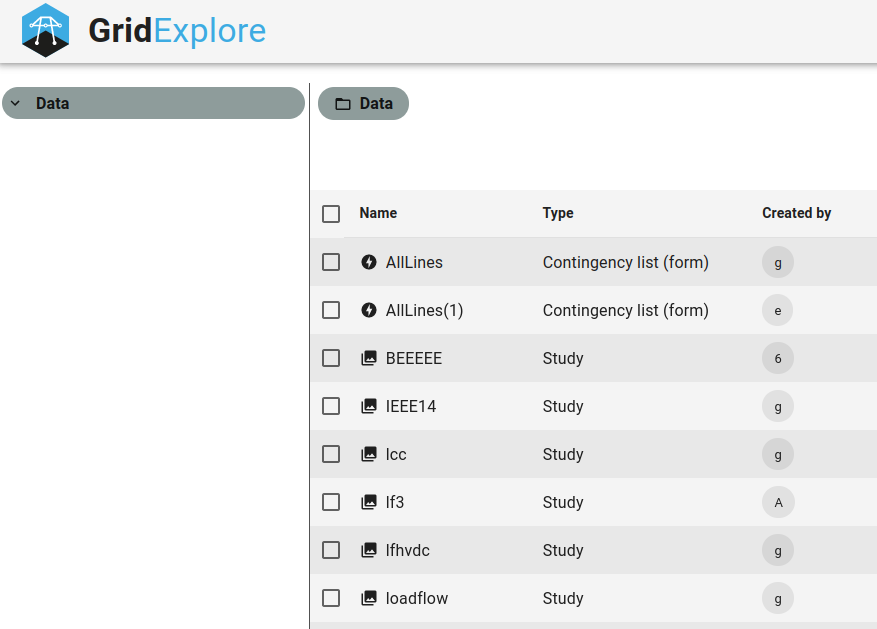
- GridExplore allows you to import your data and setup your explorations with filters or contingency lists.
- GridStudy is the place to visualize either on a geographical map or on single line diagrams one imported network case, and explore the effects of network modifications on power flows or other kind of analyses (security analysis, sensitivity analysis, short-circuit analysis, dynamic simulation analysis and more to follow).
- import network cases.
- create network studies from these cases.
- create filters. They allow to target some elements of a network for operations like network modifications. Filters can be created by explicitly listing network equipments ids, or by generic filter conditions based on electrical attributes of the equipments.
- create contingency lists. They allow to define the scope of a security analysis. They can be created by the same generic conditions as filters, or by an even more flexible arbitrary groovy script.
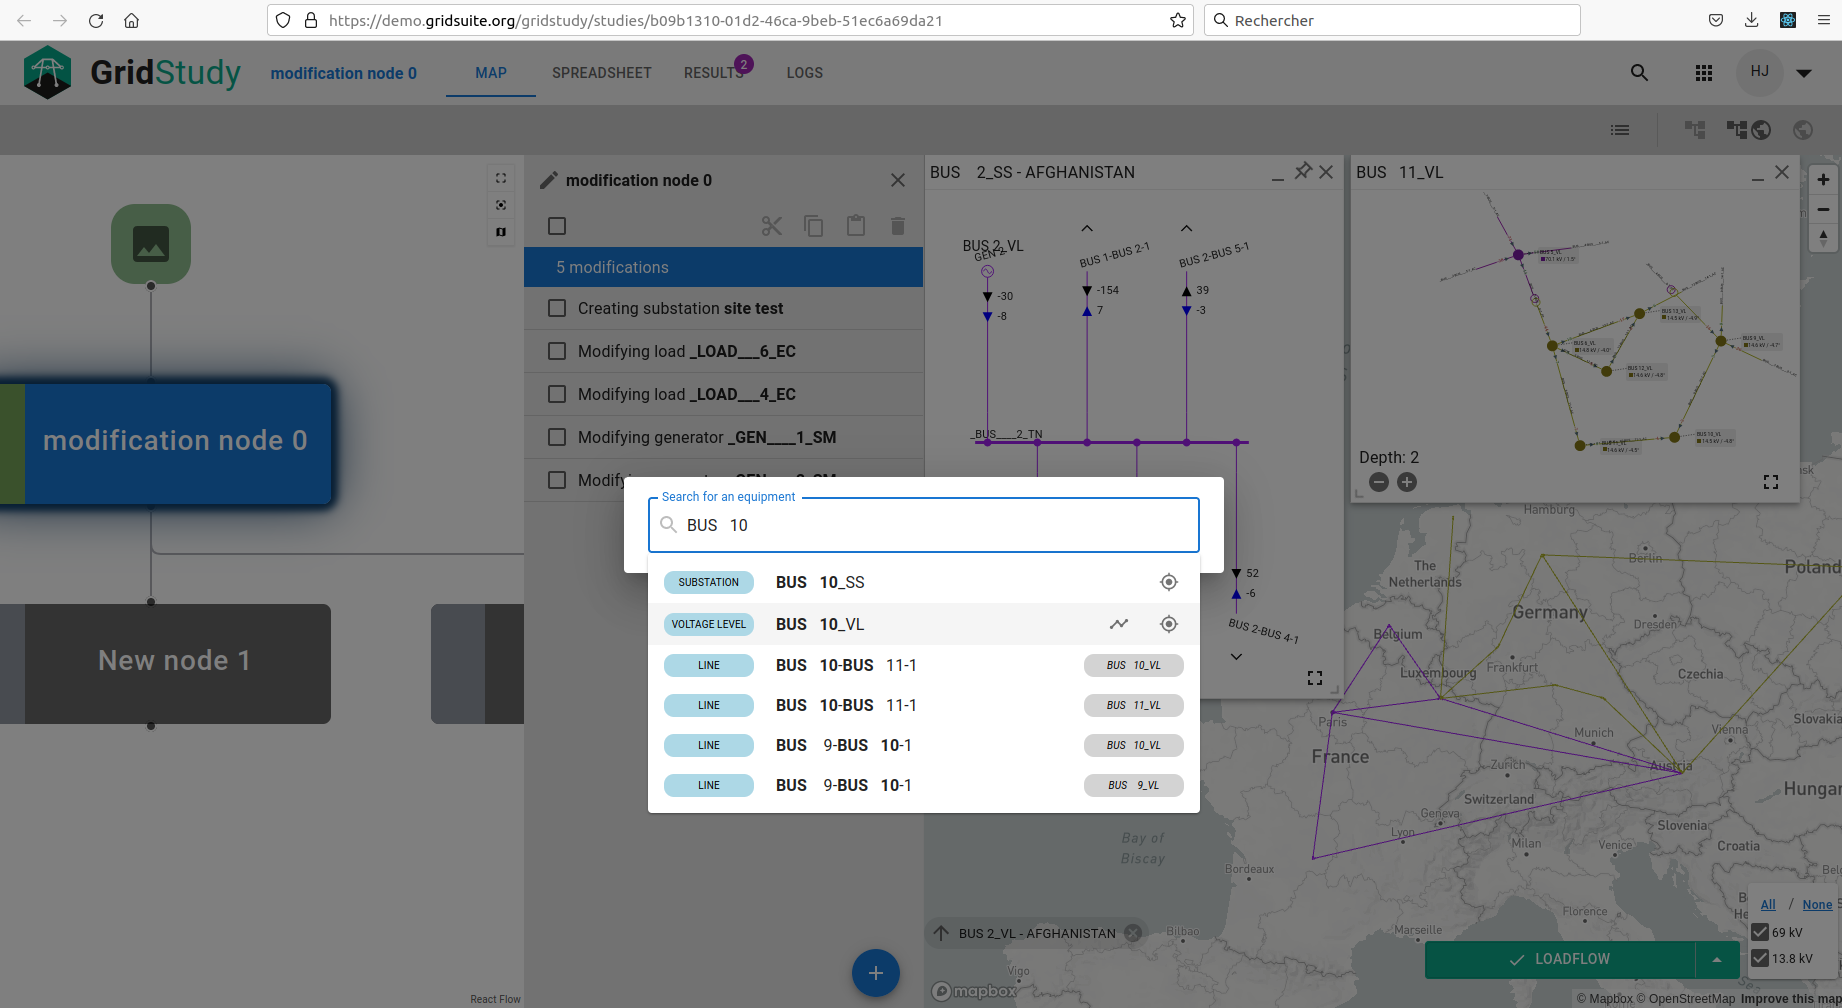
- Search for equipments (CTRL+F or click on the magnifying glass in the top right corner).
- Display single line diagrams of substations or voltage level by clicking on them on the map or in the search results.
- Display network area diagrams by clicking on the zigzag icon in the voltage level search results.
- Navigate to substations and voltage level in the geographical map by clicking on the gps icon on the search results.
- View power flows (MW, MVar) directly on the geographical map or in the single line diagrams.
- Create network variations in trees that allows sharing common modifications and visualize nodes in the tree. Modification may be equipment value modifications, topology changes or equipment creations or deletions.
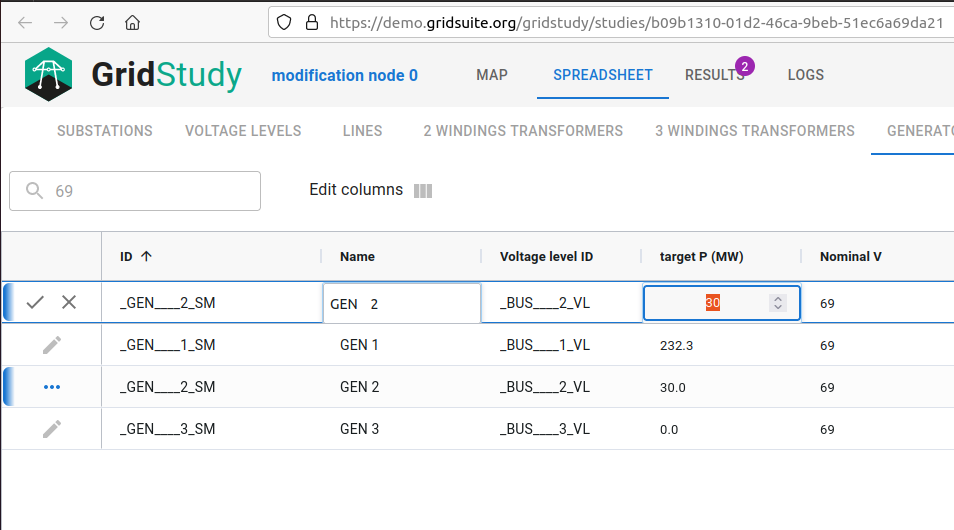
- Search and visualize network equipments on the table tab
- Create network modifications by setting values directly in the table
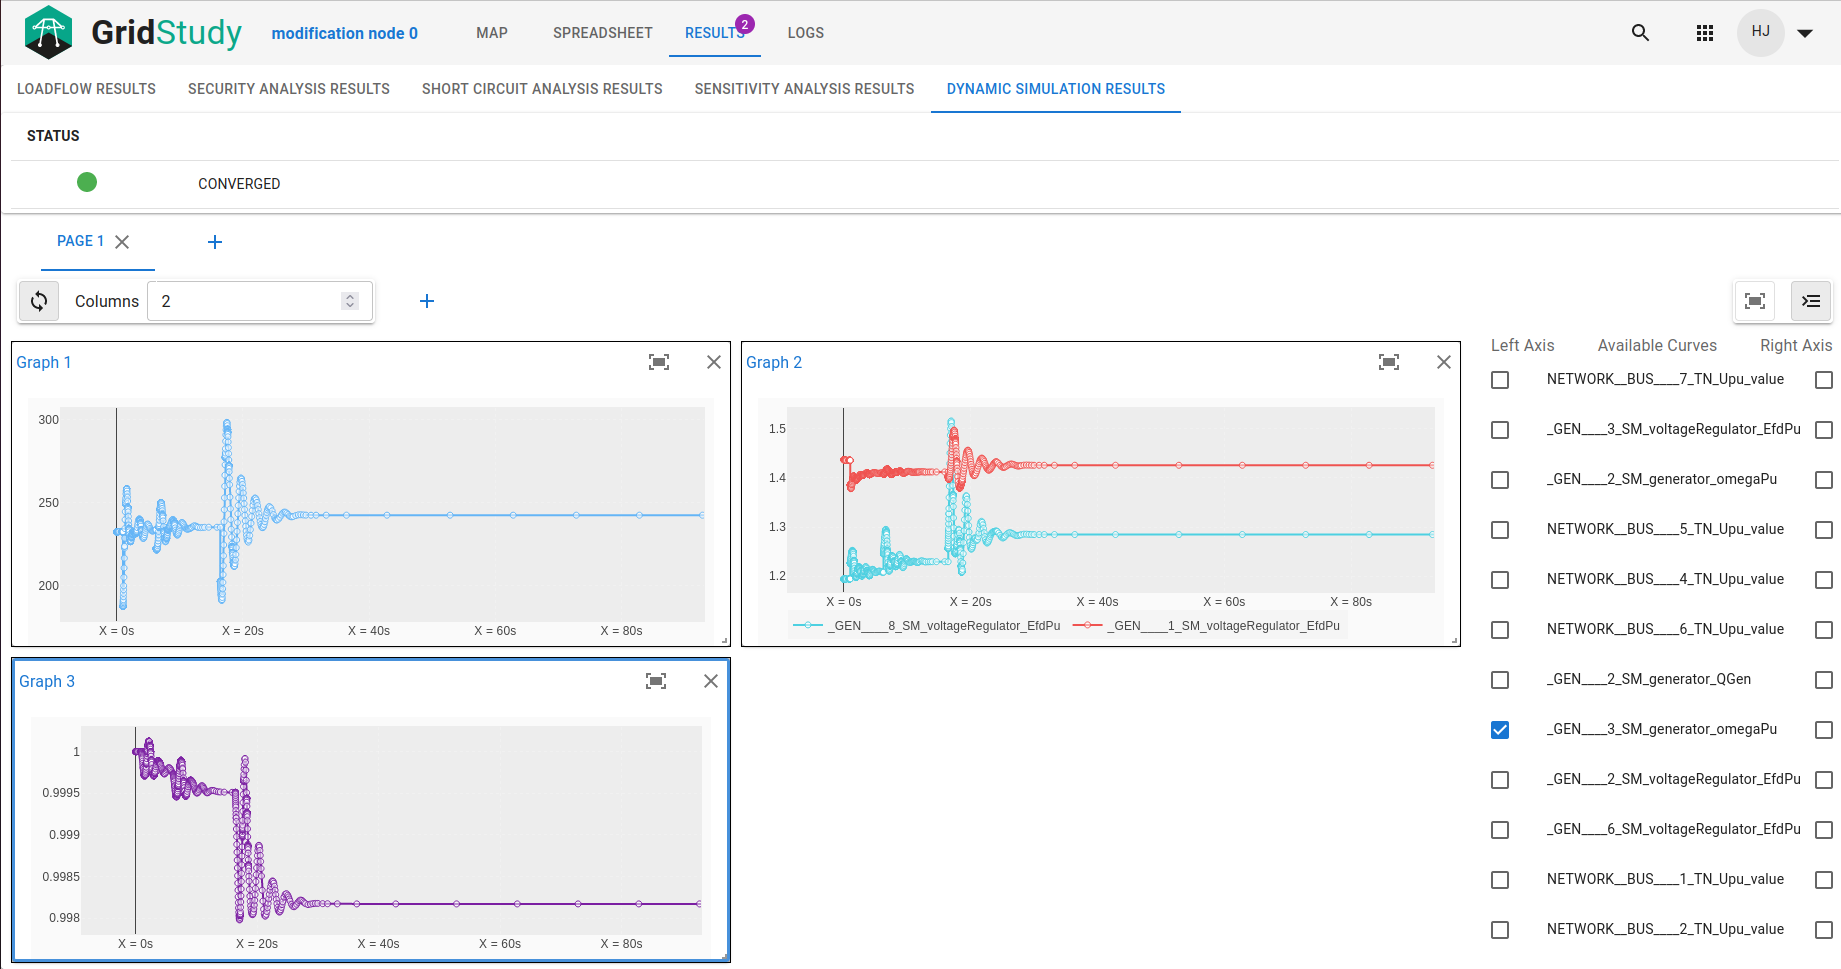
Analyze simulations results in the results tabs
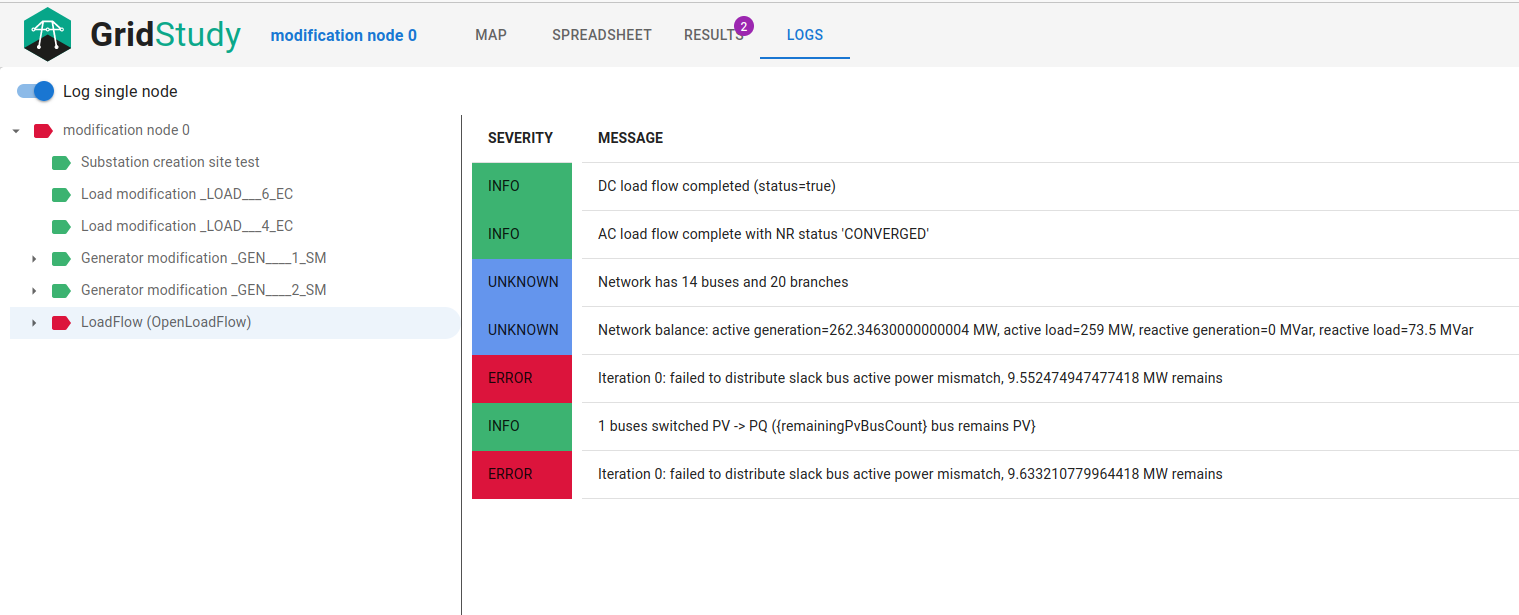
Read network reports generated during the import or during the execution of simulations.