

The through-line across everything here: the obvious metric points one way, the mechanism underneath points the other.
- bike-venture-turnaround - The Bounce-Back — A marketing performance audit that pulled a team out of a Q3 collapse and back to profitability by Q6.
- delivery-economics-dashboard - Delivery Economics — A white-glove delivery operation losing $1,156 on 13 orders.
- h1b-sponsorship-sql-analysis - Which Employers Reliably Sponsor H-1B Business Roles — SQL analysis of 3.47M H-1B filings (2020–2023).
- massachusetts-h1b-analysis - Massachusetts H-1B Analysis — Reading the Massachusetts labor market through five years of public H-1B filing data: which employers sponsor repeatedly, and do business roles pay as well as analytics roles?
- superstore-discount-ceiling - Where Should We Spend the Next Ad Dollar? — A marketing analytics lead has an ad budget and a room full of managers who read the business through sales volume.
|
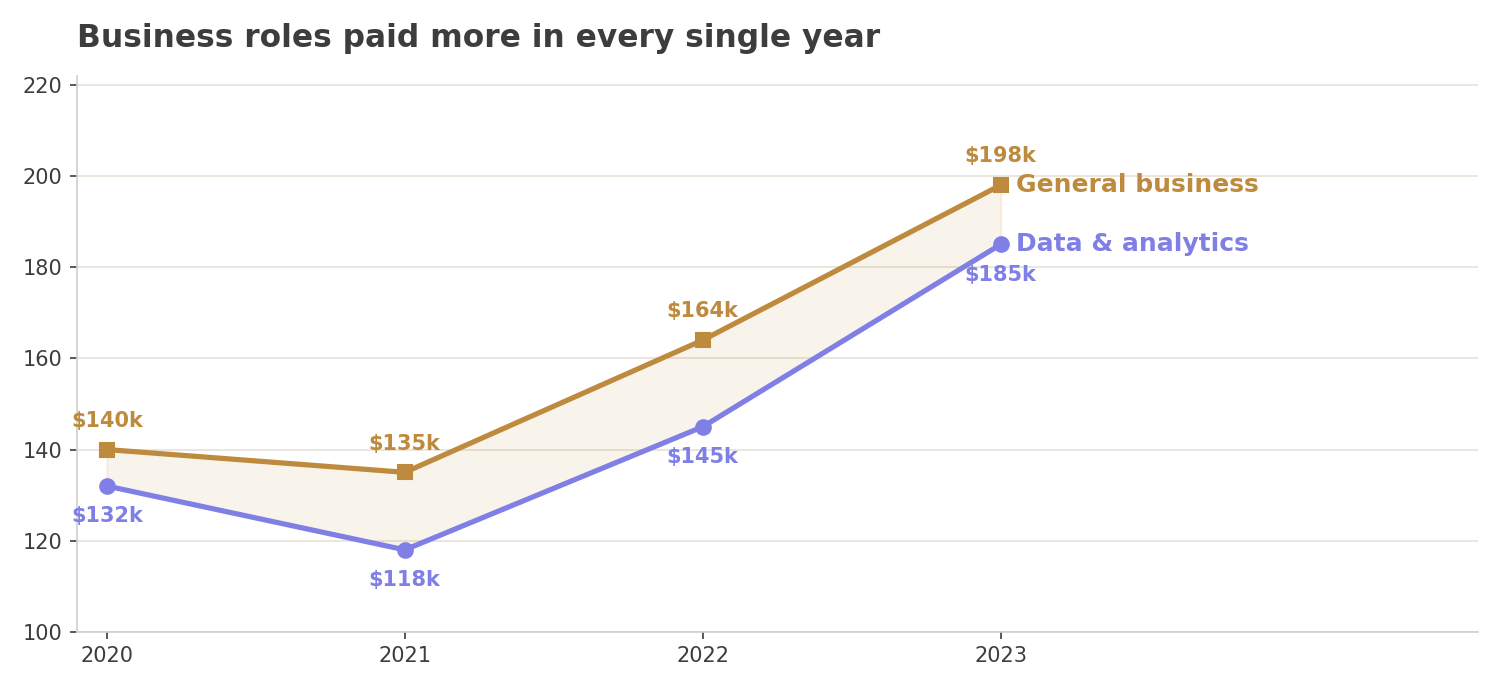
SQL analysis of 3.47M H-1B filings (2020–2023). The business-role wage premium survives on medians — then breaks honestly when IT managers are excluded. 3.47M filings · 8 queries |
|
|
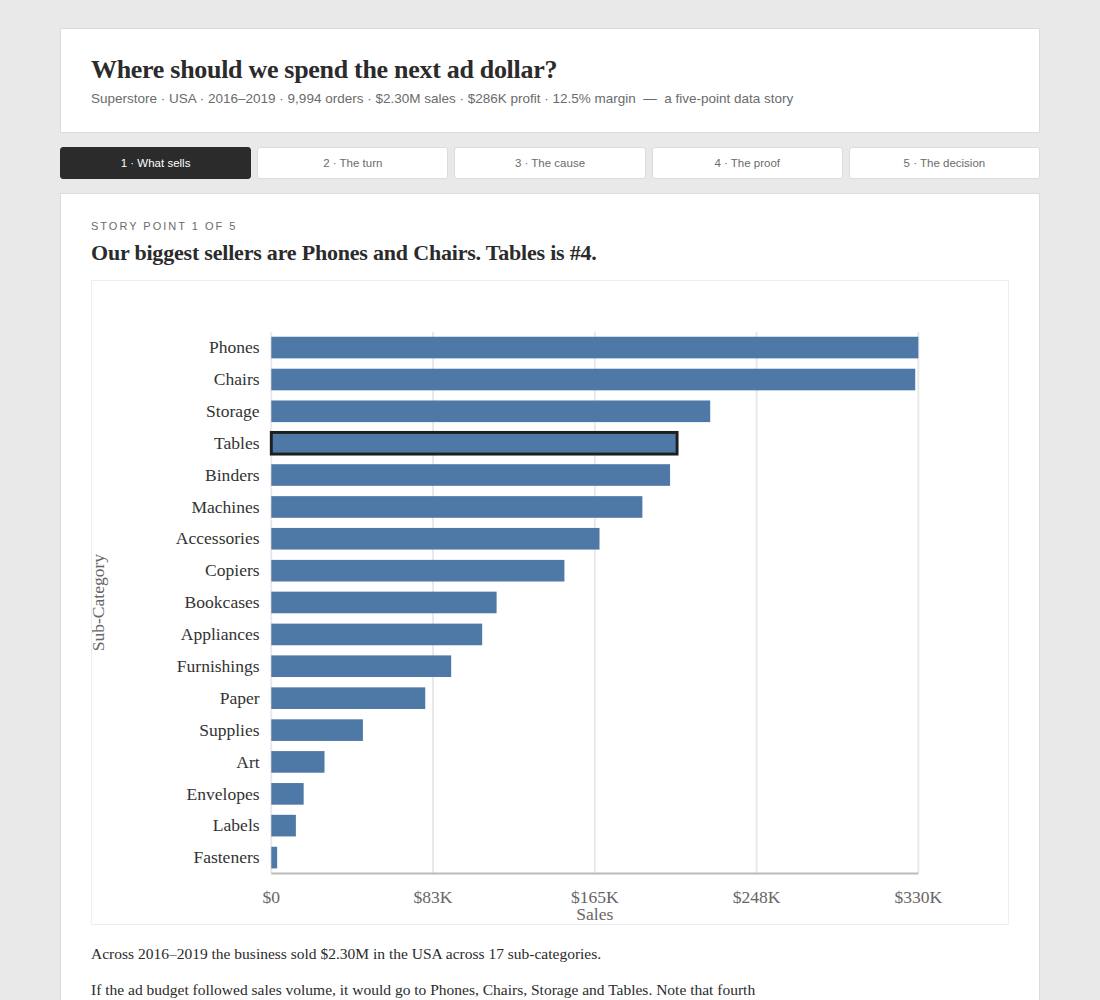
A marketing analytics lead has an ad budget and a room full of managers who read the business through sales volume. This dashboard makes the case for spending it elsewhere, and lets the room test the recommendation live. 9,994 order lines · 20% discount ceiling Repo · Tableau Public · Interactive dashboard · All case studies |
|
|
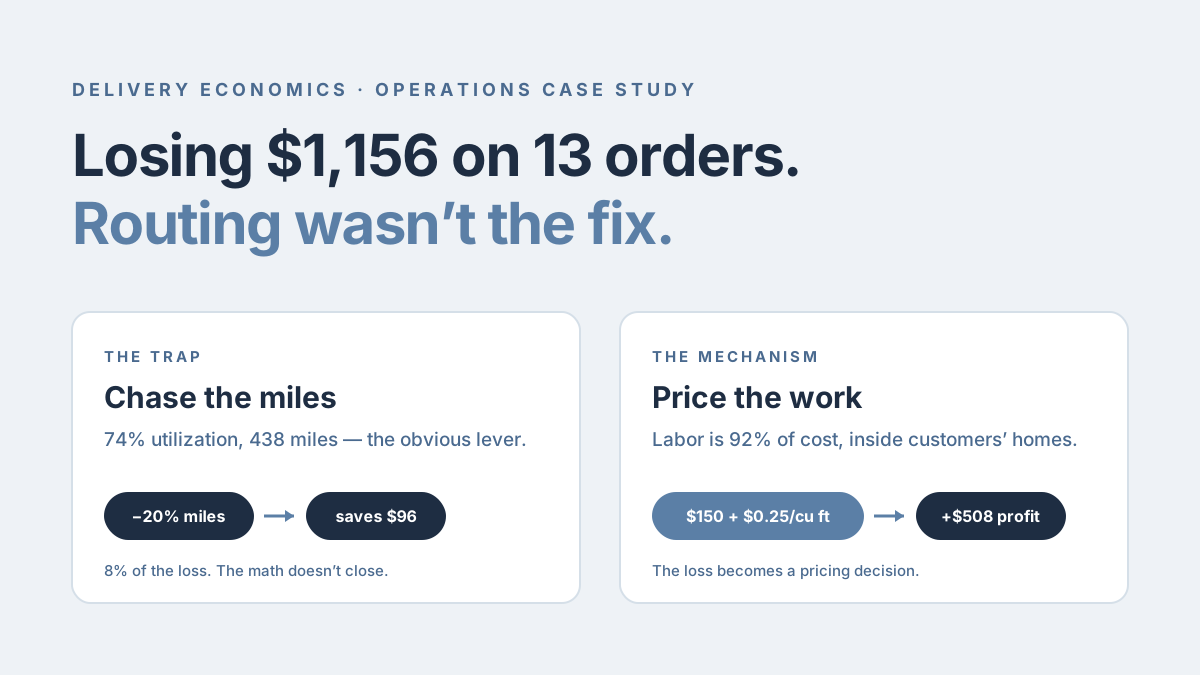
A white-glove delivery operation losing $1,156 on 13 orders. I rebuilt the whole case from 171 raw order lines: the cost model, the 7-day operating schedule, and the operating system that runs the day. 171 order lines · 7-day schedule Repo · Presentation · Dashboard · Operations design · All case studies |
|
|
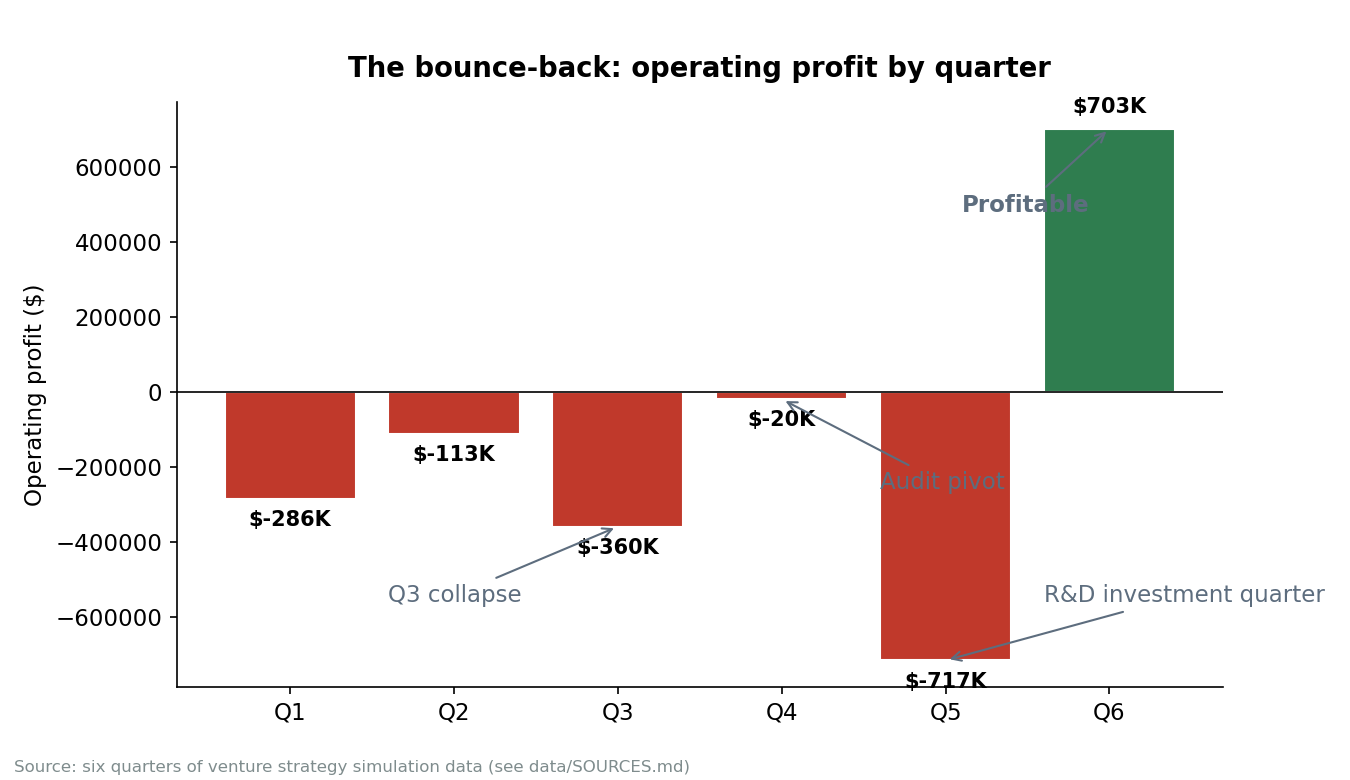
A marketing performance audit that pulled a team out of a Q3 collapse and back to profitability by Q6. 6 quarters · −$360K to +$703K |
|
|
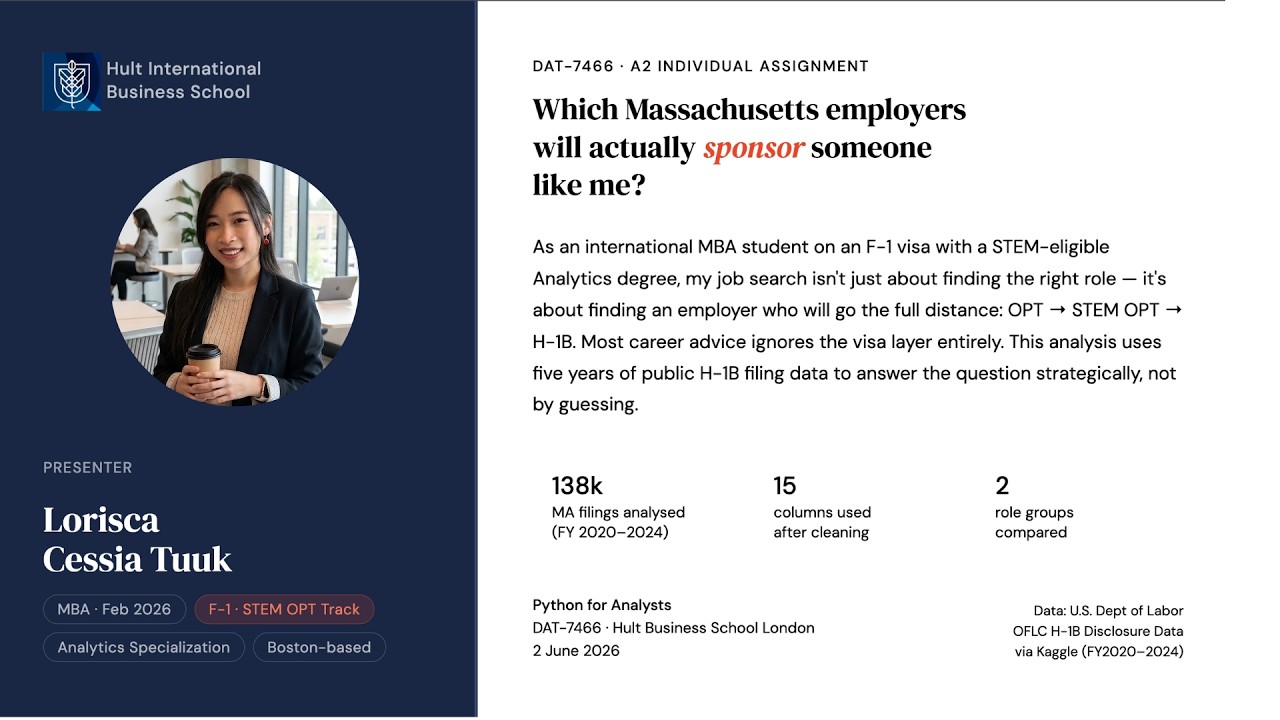
I'm on an F-1 visa. Finding the right role isn't the whole job search — I need an employer who'll go the full distance: OPT → STEM OPT → H-1B. So I read 137,866 Massachusetts H-1B filings (FY2020–2024) and asked: do the business roles I'd apply to get sponsored as often, and pay as well, as the data-and-analytics roles my visa plan leans on? The answer: 13,672 vs 14,035 filings. $105,000 vs $104,000 median pay — statistically the same. 0% vs 100% STEM — the H-1B clock is tighter on the business side. The correction: an earlier version reported $115,000 for the business median — 2,583 IT managers had slipped into the business group through their occupation code. Re-ran without them: $105,000. The notebook shows exactly what changed. The walkthrough:
|
|
|
Hiring, retention, and workforce data. 1 shipped · 4 in the pipeline |
SQL, machine learning, and BI — built to support one decision, with limits stated. 2 shipped · 6 in the pipeline |
|
Business cases, pricing, and delivery — the numbers behind the story. 2 shipped · 7 in the pipeline |
Live-client engagements — real stakeholders, real constraints. Team-based consulting work with deliverables, distinct from solo analyses. 2 in the pipeline |
In the pipeline — works in progress, real titles, no filler
Talent Systems
- Cleaning a visa dataset without deleting the signal
- The recruitment single source of truth (Bank Mega)
- Attrition was a promotion problem
- Making a gender-gap contradiction visible
Analytics & Models
- Predicting income bracket, and knowing when to stop
- Where a vaccine supply strategy should point
- A board bonus that looked already lost
- A sales peak that was not growth
- Forecasting a seasonal business three ways
- Testing a straight-line forecast against reality
Strategy & Operations
- Two identical-looking tech giants with opposite economics
- Cost of capital for a company that barely borrows
- Whether a Chilean neobank is actually revolutionary
- A brand that outgrew its own positioning
- Auditing an AI transformation pitch as the person funding it
- Scoring a hardware launch before planning it
- Designing a scorecard for a firm that only measured revenue
Consulting
- M&T Bank — live-client engagement (D1–D6 deliverables)
- Autodesk AutoProc — LATAM procurement strategy
Personal site · Analytics Work · Builds · Email · LinkedIn · GitHub