
Interactive visualisations in .NET / F#. Version: 0.0.1-pre4
Author: Matt Jones License: MIT
Plot up line charts in .NET and edit these in realtime, through the power of HighCharts and Plotly (coming!).
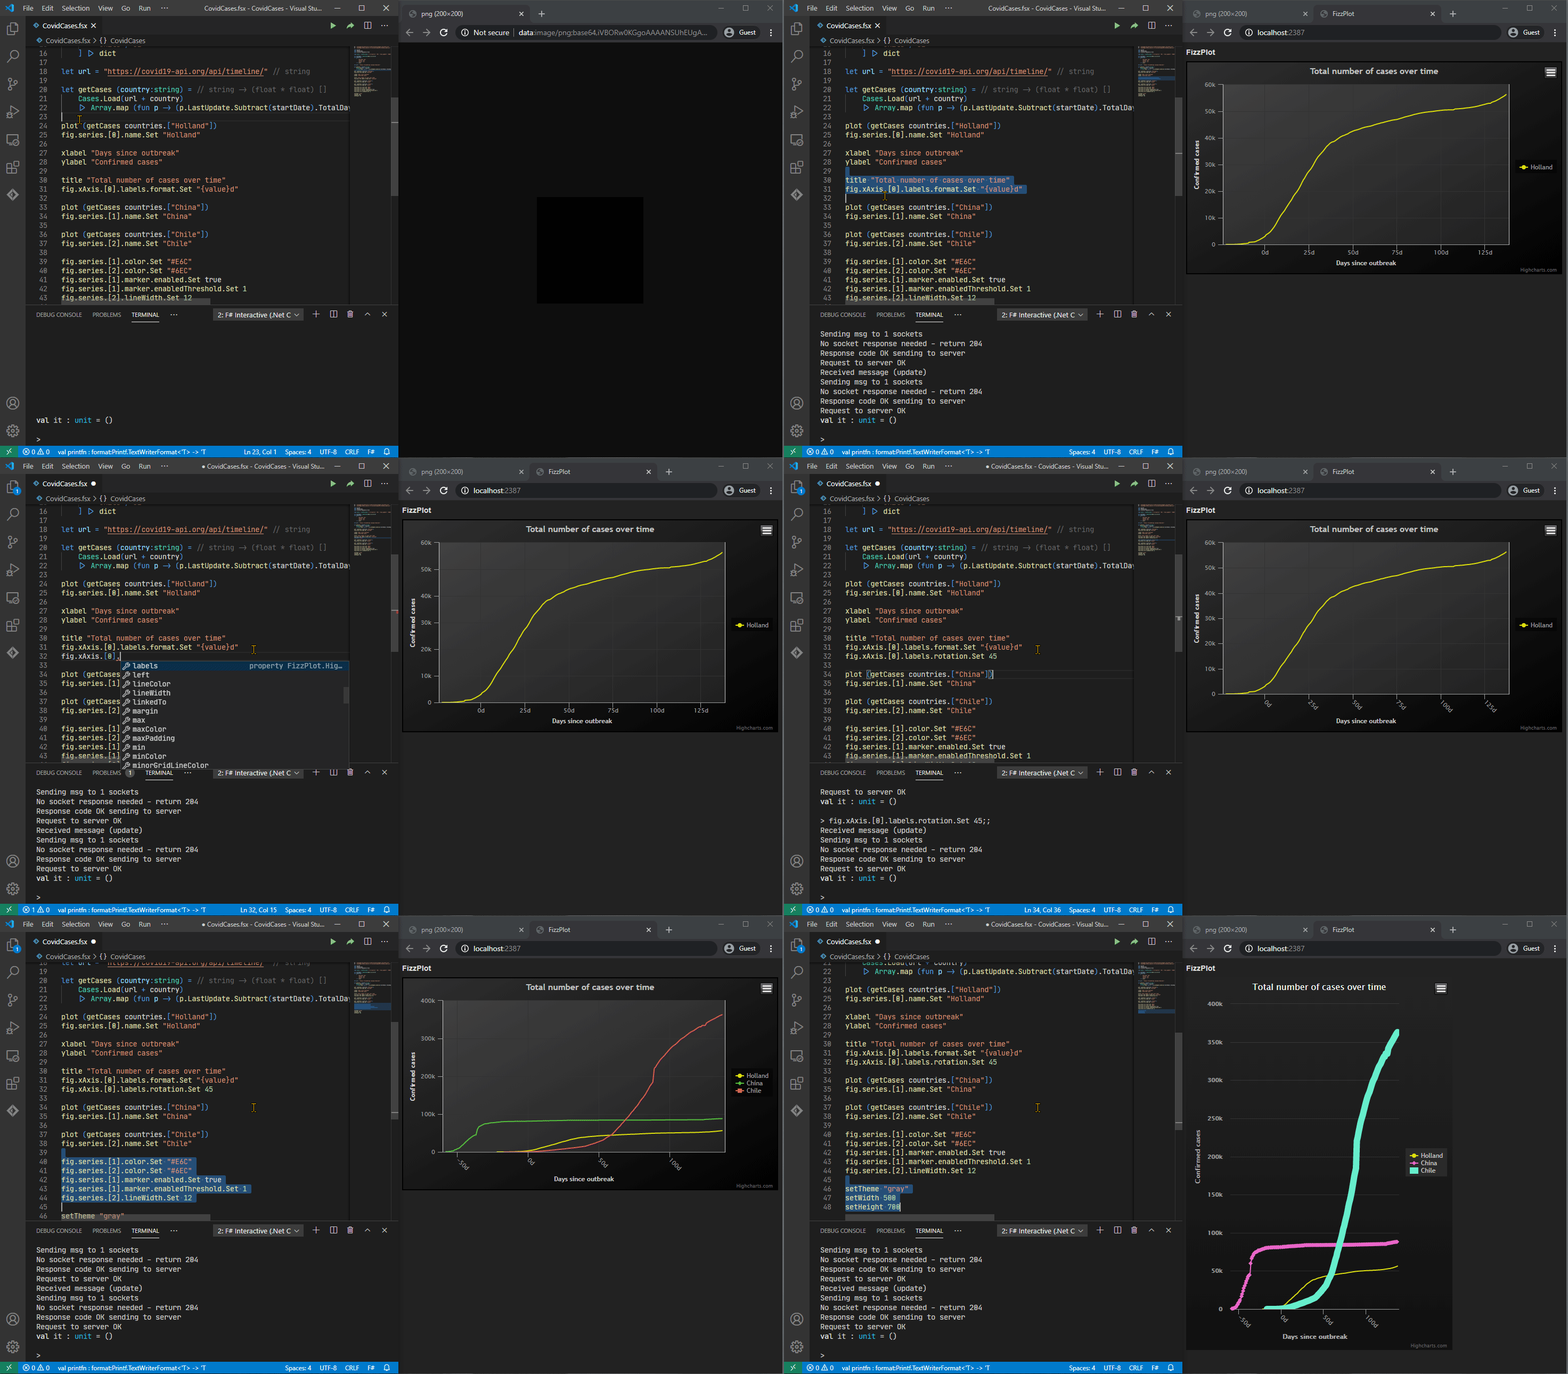
Generate beautiful line charts from within the FSI (FSharp Interactive) window.
Please note: Commercial use of HighCharts requires a license.
Requirements: Runs on .NET Core 3.1 (the library itself is .NET Standard 2.0), so you will need to install the .NET Core SDK (install here). This will also install the dotnet CLI, which is required to start the server.
In the root folder of the repo, open a terminal and type:
.\build.bat
dotnet run --project Demo/Demo.fsproj
This will open your browser and navigate to http://localhost:2387/ to show your plot.
To create a new project for plotting data with FizzPlot, run the following from a command prompt / shell:
dotnet new console -lang f# -n FizzDemo
cd FizzTest
dotnet add package fizzplot -v 0.0.1-*
Then, open Program.fs and enter the following:
open FizzPlot.HighCharts.Plot

let d = [for t in 0.0 .. 0.01 .. 1.0 -> (t,t * sin 20.0 * t) ]
plot d
To run the program, navigate to the project directory and type the following in the command prompt / shell:
dotnet run
This will open your browser and navigate to http://localhost:2387/ to show your plot.
To run FizzPlot in an Fsharp Interactive window (FSI) from an F# Script, you will first need to get hold of the nuget package. Until .Net 5 is released, this is best achieved by first creating a new project:
dotnet new console -lang f# -n FizzTest
cd FizzTest
dotnet add package fizzplot -v 0.0.1-* --package-directory .\packages
The last command will download the nuget package and place it in a subdirectory called 'packages' within the project directory. This makes it easier to reference from within a script. Next, create a new .fsx script file in the project directory, and reference the downloaded nuget package to start plotting:
#r "./packages/fizzplot/0.0.1-pre4/lib/netcoreapp3.1/FizzPlot.dll"

open FizzPlot.HighCharts.Plot

let d = [for t in 0.0 .. 0.01 .. 1.0 -> (t,t * sin 20.0 * t) ]
plot d
Highlight all these lines and send to FSI using Alt-Enter.
Once the appropriate reference to the FizzPlot library has been added, you can generate a chart like so:
open FizzPlot.HighCharts.Plot

let xy = [(0.0,2.2),(1.0,1.4),(2.0,0.8)]

plot xy
title "X vs Y"
xlabel "X"
ylabel "Y"

setWidth 1200
setHeight 500
This will start the local server and generate the chart which can be viewed in any tab of the browser (all tabs show the same set of plots).
Refer to the Demo.fsx script for additional examples.
To access more chart-specific options (e.g. series formatting, tooltips and lgend properties) you need to use the fig object, which exposes all available options. Once you have navigated to the property you wish to set, call the Set() method on this, for example:
fig.chart.plotBorderWidth.Set 2
fig.tooltip.style.color.Set "#1F1"

fig.series.[0].lineWidth.Set 2
You will get intellisense on all available objects when pressing the . after fig, and each successive property.
Where properties are not described by simple strings or numbers, anonymous records are used to define the property values:
fig.legend.navigation.Set {| activeColor="#a2412f"; inactiveColor="#6a6a6a" |}For additional help with HighCharts options, the HighCharts configuration options API reference may be of use.
Colours are specified as strings in the following forms:
"#F0F"
"#A1FE28"
"rgb(18, 255, 67, 0.8)" // This includes an alpha value, between 0.0 and 1.0
Series properties such as name, line style, width and colour can be adjusted:
fig.series.[0].name.Set "Name"
fig.series.[0].color.Set "#AAFF22"
fig.series.[0].marker.enabled.Set true
fig.series.[0].marker.enabledThreshold.Set 4
fig.series.[0].marker.fillColor.Set "#CCC"
fig.series.[0].dashStyle.Set "Dash"

fig.series.[1].name.Set "Envelope"
fig.series.[1].lineWidth.Set 4
fig.series.[1].marker.enabled.Set false
Valid line styles are:
Solid
ShortDash
ShortDot
ShortDashDot
ShortDashDotDot
Dot
Dash
LongDash
DashDot
LongDashDot
LongDashDotDot
Axis range and type (logarithmic / linear) can be set. Set both max and min to control the range. Limits are usually rounded to tick locations, but this can be controlled by setting the endOnTick property.
fig.xAxis.[0].min.Set 0.0
fig.xAxis.[0].max.Set 120.0
fig.xAxis.[0].gridLineWidth.Set 3
fig.xAxis.[0].gridLineColor.Set "#F0F"

fig.yAxis.[0]._type.Set "logarithmic"
fig.yAxis.[0].endOnTick.Set false
fig.yAxis.[0].max.Set 0.5
Valid types of axis are:
linear
logarithmic
Tick display options include label placement, format and also tick colours / thickness.
fig.xAxis.[0].tickColor.Set "#CCC"
fig.xAxis.[0].tickLength.Set 8
fig.xAxis.[0].tickInterval.Set 10.0
fig.xAxis.[0].labels.rotation.Set 45
fig.xAxis.[0].labels.format.Set "{value} s"
Title can be styled using options including:
fig.title.style.fontFamily.Set "Courier New"
fig.title.style.fontSize.Set "18pt"
fig.title.style.color.Set "#BBB"
The style options generally
Legend position and colour options are available, such as:
fig.legend.layout.Set "horizontal"
fig.legend.align.Set "left"
fig.legend.backgroundColor.Set "#000"
fig.legend.enabled.Set false
fig.legend.backgroundColor.Set "#484"
fig.tooltip.shadow.Set false
fig.tooltip.backgroundColor.Set "rgb(230,230,220,0.5)"
fig.tooltip.style.fontFamily.Set "Verdana"
fig.tooltip.style.lineWidth.Set 80Theme, background and various other styling options can be changed:
setTheme "gray"

fig.chart.plotBackgroundColor.Set "#222"
fig.chart.plotBorderColor.Set "#CEE"
fig.chart.plotBorderWidth.Set 4
Valid themes are currently:
default
dark
gray
Charts can be exported as PNG using either the button on the top right of the image, or programmatically using the following function:
save ".\\img.png"
This uses the HighCharts export server to generate the image and save as a local file.
Since the updates are live, FizzPlot is particularly suited to use in an interactive setting where you make an initial plot with the data, and then make subsequent tweaks to the visuals until happy with the results.