About • Quickstart • Examples • Documentation • References • Contact • Acknowledgments
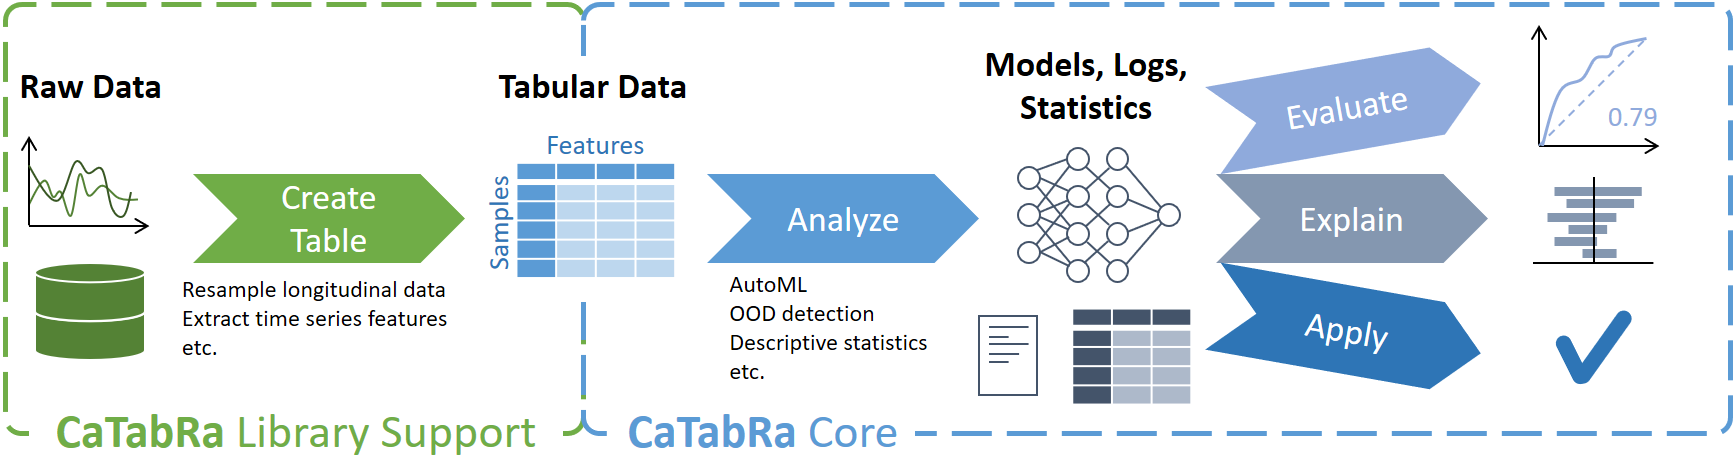
CaTabRa is a Python package for analyzing tabular data in a largely automated way. This includes generating descriptive statistics, creating out-of-distribution detectors, training prediction models for classification and regression tasks, and evaluating/explaining/applying these models on unseen data.
CaTabRa is both a command-line tool and a library, which means it can be easily integrated into other projects. If you only need particular data processing functions but do not want to install all of CaTabRa, check out CaTabRa-pandas and CaTabRa-lib: they have minimal dependencies and run on every platform.
Clone the repository and install the package with Poetry. Set up a new Python environment with Python >=3.9, <3.11 (e.g. using conda), activate it, and then run
pip install poetry(unless Poetry has been installed already) and
git clone https://github.com/risc-mi/catabra.git
cd catabra
poetry install
The project is installed in editable mode by default. This is useful if you plan to make changes to CaTabRa's code.
IMPORTANT: CaTabRa currently only runs on Linux, because
auto-sklearn only runs on Linux. On Windows,
you can use a virtual machine, like WSL 2, and install CaTabRa
there. If you want to use Jupyter, install Jupyter on the virtual machine as well and launch it with the --no-browser
flag.
python -m catabra analyze example_data/breast_cancer.csv --classify diagnosis --split train --out breast_cancer_resultThis command analyzes breast_cancer.csv and trains a prediction model for classifying the samples according to column
"diagnosis". Column "train" is used for splitting the data into a train- and a test set, which means that the final
model is automatically evaluated on the test set after training. All results are saved in directory breast_cancer_out.
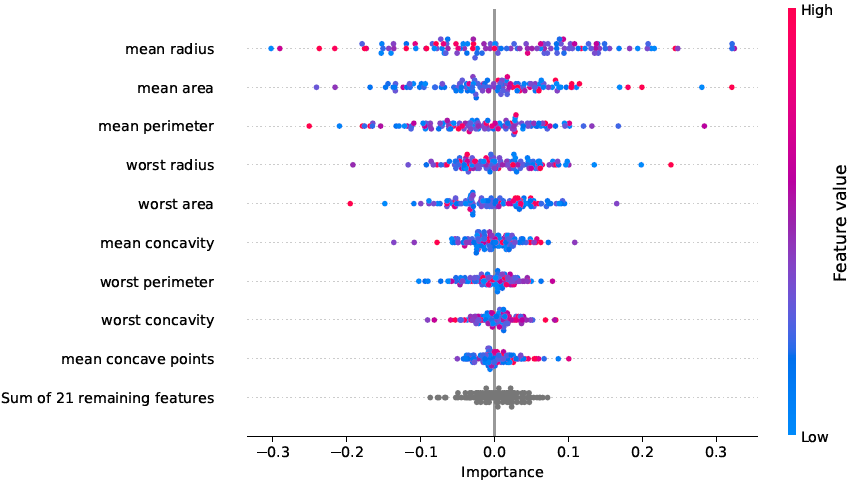
python -m catabra explain breast_cancer_result --on example_data/breast_cancer.csv --out breast_cancer_result/explThis command explains the classifier trained in the previous command by computing SHAP feature importance scores for
every sample. The results are saved in directory breast_cancer_result/expl. Depending on the type of the trained
models, this command may take several minutes to complete.
The two commands above translate to the following Python code:
from catabra.analysis import analyze
from catabra.explanation import explain

analyze("example_data/breast_cancer.csv", classify="diagnosis", split="train", out="breast_cancer_result")
explain("example_data/breast_cancer.csv", "breast_cancer_result", out="breast_cancer_result/expl")Invoking the two commands generates a bunch of results, most notably
- the trained classifier
- descriptive statistics of the underlying data
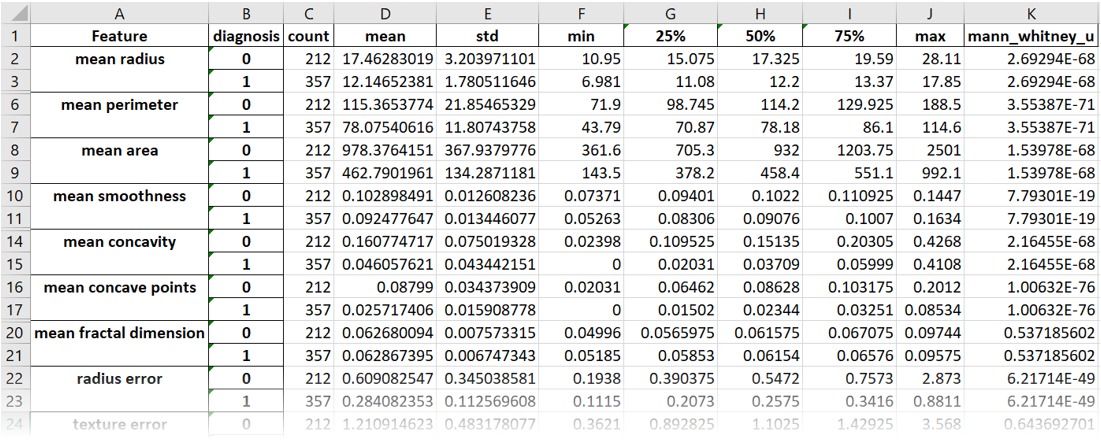
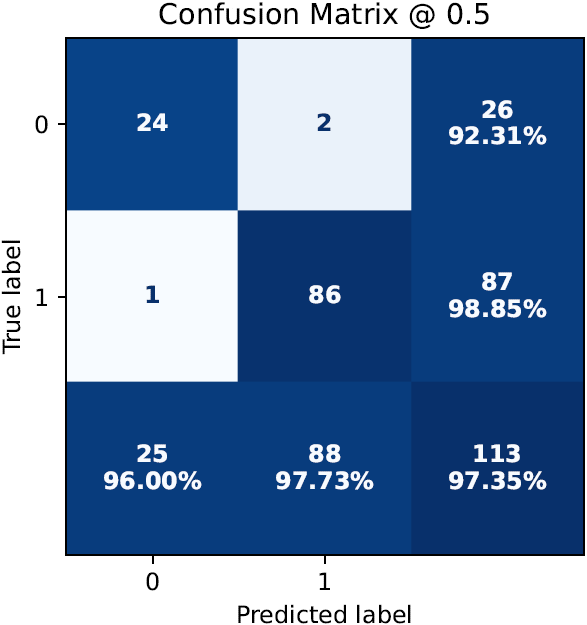
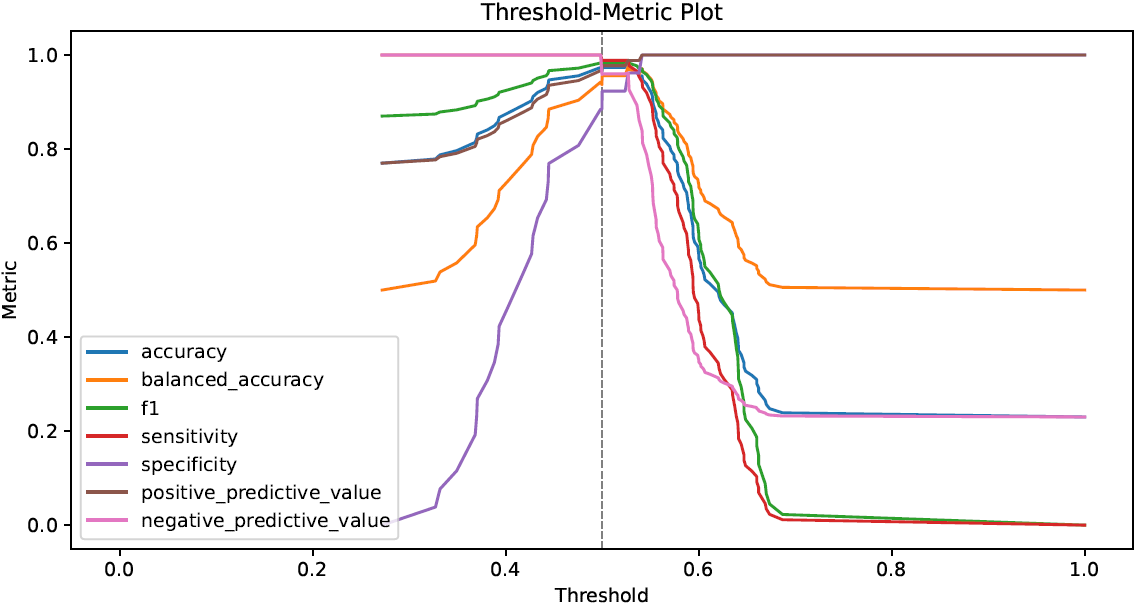
- performance metrics in tabular and graphical form
- feature importance scores in tabular and graphical form
- ... and many more.
The source notebooks for all our examples can be found in the examples folder.
- Workflow.ipynb
- Analyze data with a binary target
- Train a high-quality classifier with automatic model selection and hyperparameter tuning
- Investigate the final classifier and the training history
- Calibrate the classifier on dedicated calibration data
- Evaluate the classifier on held-out test data
- Explain the classifier by computing SHAP- and permutation importance scores
- Apply the classifier to new samples
- Longitudinal.ipynb
- Process longitudinal data by resampling into "samples x features" format
- Prediction-Tasks.ipynb
- Binary classification
- Multiclass classification
- Multilabel classification
- Regression
- House-Sales-Regression.ipynb
- Predicting house prices
- Performance-Metrics.ipynb
- Change hyperparameter optimization objective
- Specify metrics to calculate during model training
- Plotting.ipynb
- Create plots in Python
- Create interactive plots
- AutoML-Config.ipynb
- General configuration
- Ensemble size
- Time- and Memory budget
- Number of parallel jobs
- Auto-Sklearn-specific configuration
- Model classes and preprocessing steps
- Resampling strategies for internal validation
- Grouped splitting
- General configuration
- Fixed-Pipeline.ipynb
- Specify fixed ML pipeline (no automatic hyperparameter optimization)
- Manually configure hyperparameters
- Suitable for creating baseline models
- AutoML-Extension.ipynb
- Add new AutoML backend
- Explanation-Extension.ipynb
- Add new explanation backend
- OOD-Extension.ipynb
- Add new OOD detection backend
API Documentation as well as detailed documentation for a couple of specific aspects of CaTabRa, like its command-line interface, available performance metrics, built-in OOD-detectors and model explanation details can be found on our ReadTheDocs.
If you use CaTabRa in your research, we would appreciate citing the following conference paper:
-
A. Maletzky, S. Kaltenleithner, P. Moser and M. Giretzlehner. CaTabRa: Efficient Analysis and Predictive Modeling of Tabular Data. In: I. Maglogiannis, L. Iliadis, J. MacIntyre and M. Dominguez (eds), Artificial Intelligence Applications and Innovations (AIAI 2023). IFIP Advances in Information and Communication Technology, vol 676, pp 57-68, 2023. DOI:10.1007/978-3-031-34107-6_5
@inproceedings{CaTabRa2023,
  author = {Maletzky, Alexander and Kaltenleithner, Sophie and Moser, Philipp and Giretzlehner, Michael},
  editor = {Maglogiannis, Ilias and Iliadis, Lazaros and MacIntyre, John and Dominguez, Manuel},
  title = {{CaTabRa}: Efficient Analysis and Predictive Modeling of Tabular Data},
  booktitle = {Artificial Intelligence Applications and Innovations},
  year = {2023},
  publisher = {Springer Nature Switzerland},
  address = {Cham},
  pages = {57--68},
  isbn = {978-3-031-34107-6},
  doi = {10.1007/978-3-031-34107-6_5}
}
The following publications used CaTabRa for data analysis and model development:
- N. Stroh, H. Stefanits, A. Maletzky, S. Kaltenleithner, S. Thumfart, M. Giretzlehner, R. Drexler, F. Ricklefs, L. Dührsen, S. Aspalter, P. Rauch, A. Gruber and M. Gmeiner. Machine learning based outcome prediction of microsurgically treated unruptured intracranial aneurysms. Scientific Reports 13:22641, 2023. DOI:10.1038/s41598-023-50012-8
- T. Tschoellitsch, P. Moser, A. Maletzky, P. Seidl, C. Böck, T. Roland, H. Ludwig, S. Süssner, S. Hochreiter and J. Meier. Potential Predictors for Deterioration of Renal Function After Transfusion. Anesthesia & Analgesia 138(3):145-154, 2024. DOI:10.1213/ANE.0000000000006720
- T. Tschoellitsch, A. Maletzky, P. Moser, P. Seidl, C. Böck, T. Tomic Mahečić, S. Thumfart, M. Giretzlehner, S. Hochreiter and J. Meier. Machine Learning Prediction of Unsafe Discharge from Intensive Care: a retrospective cohort study. Journal of Clinical Anesthesia 99:111654, 2024. DOI:10.1016/j.jclinane.2024.111654
If you have any inquiries, please open a GitHub issue.
This project is financed by research subsidies granted by the government of Upper Austria. RISC Software GmbH is Member of UAR (Upper Austrian Research) Innovation Network.