
CloudFormation template for adding an EC2 instance with a fully automated bootstrap script to create monitoring that automatically connects to AWS CloudWatch and allows easy viewing of key metrics for AWS resources. Technologies used: Docker, CloudFormation
Description
Run EC2 instance with Docker running containers: Grafana, InfluxDB and Telegraf.
- Grafana (EC2)
- GrafanaSecurityGroup
- GrafanaIamProfile
- GrafanaRole
- GrafanaPolicy

- Log in to the AWS account
- Open CloudFormation and create a stack with new resources
- Load the template and fill in the parameters
- Visit EC2 IP address (DNS name) to access the Grafana
- User: admin
- Password: admin
Video
aws_cf_monitoring.mp4
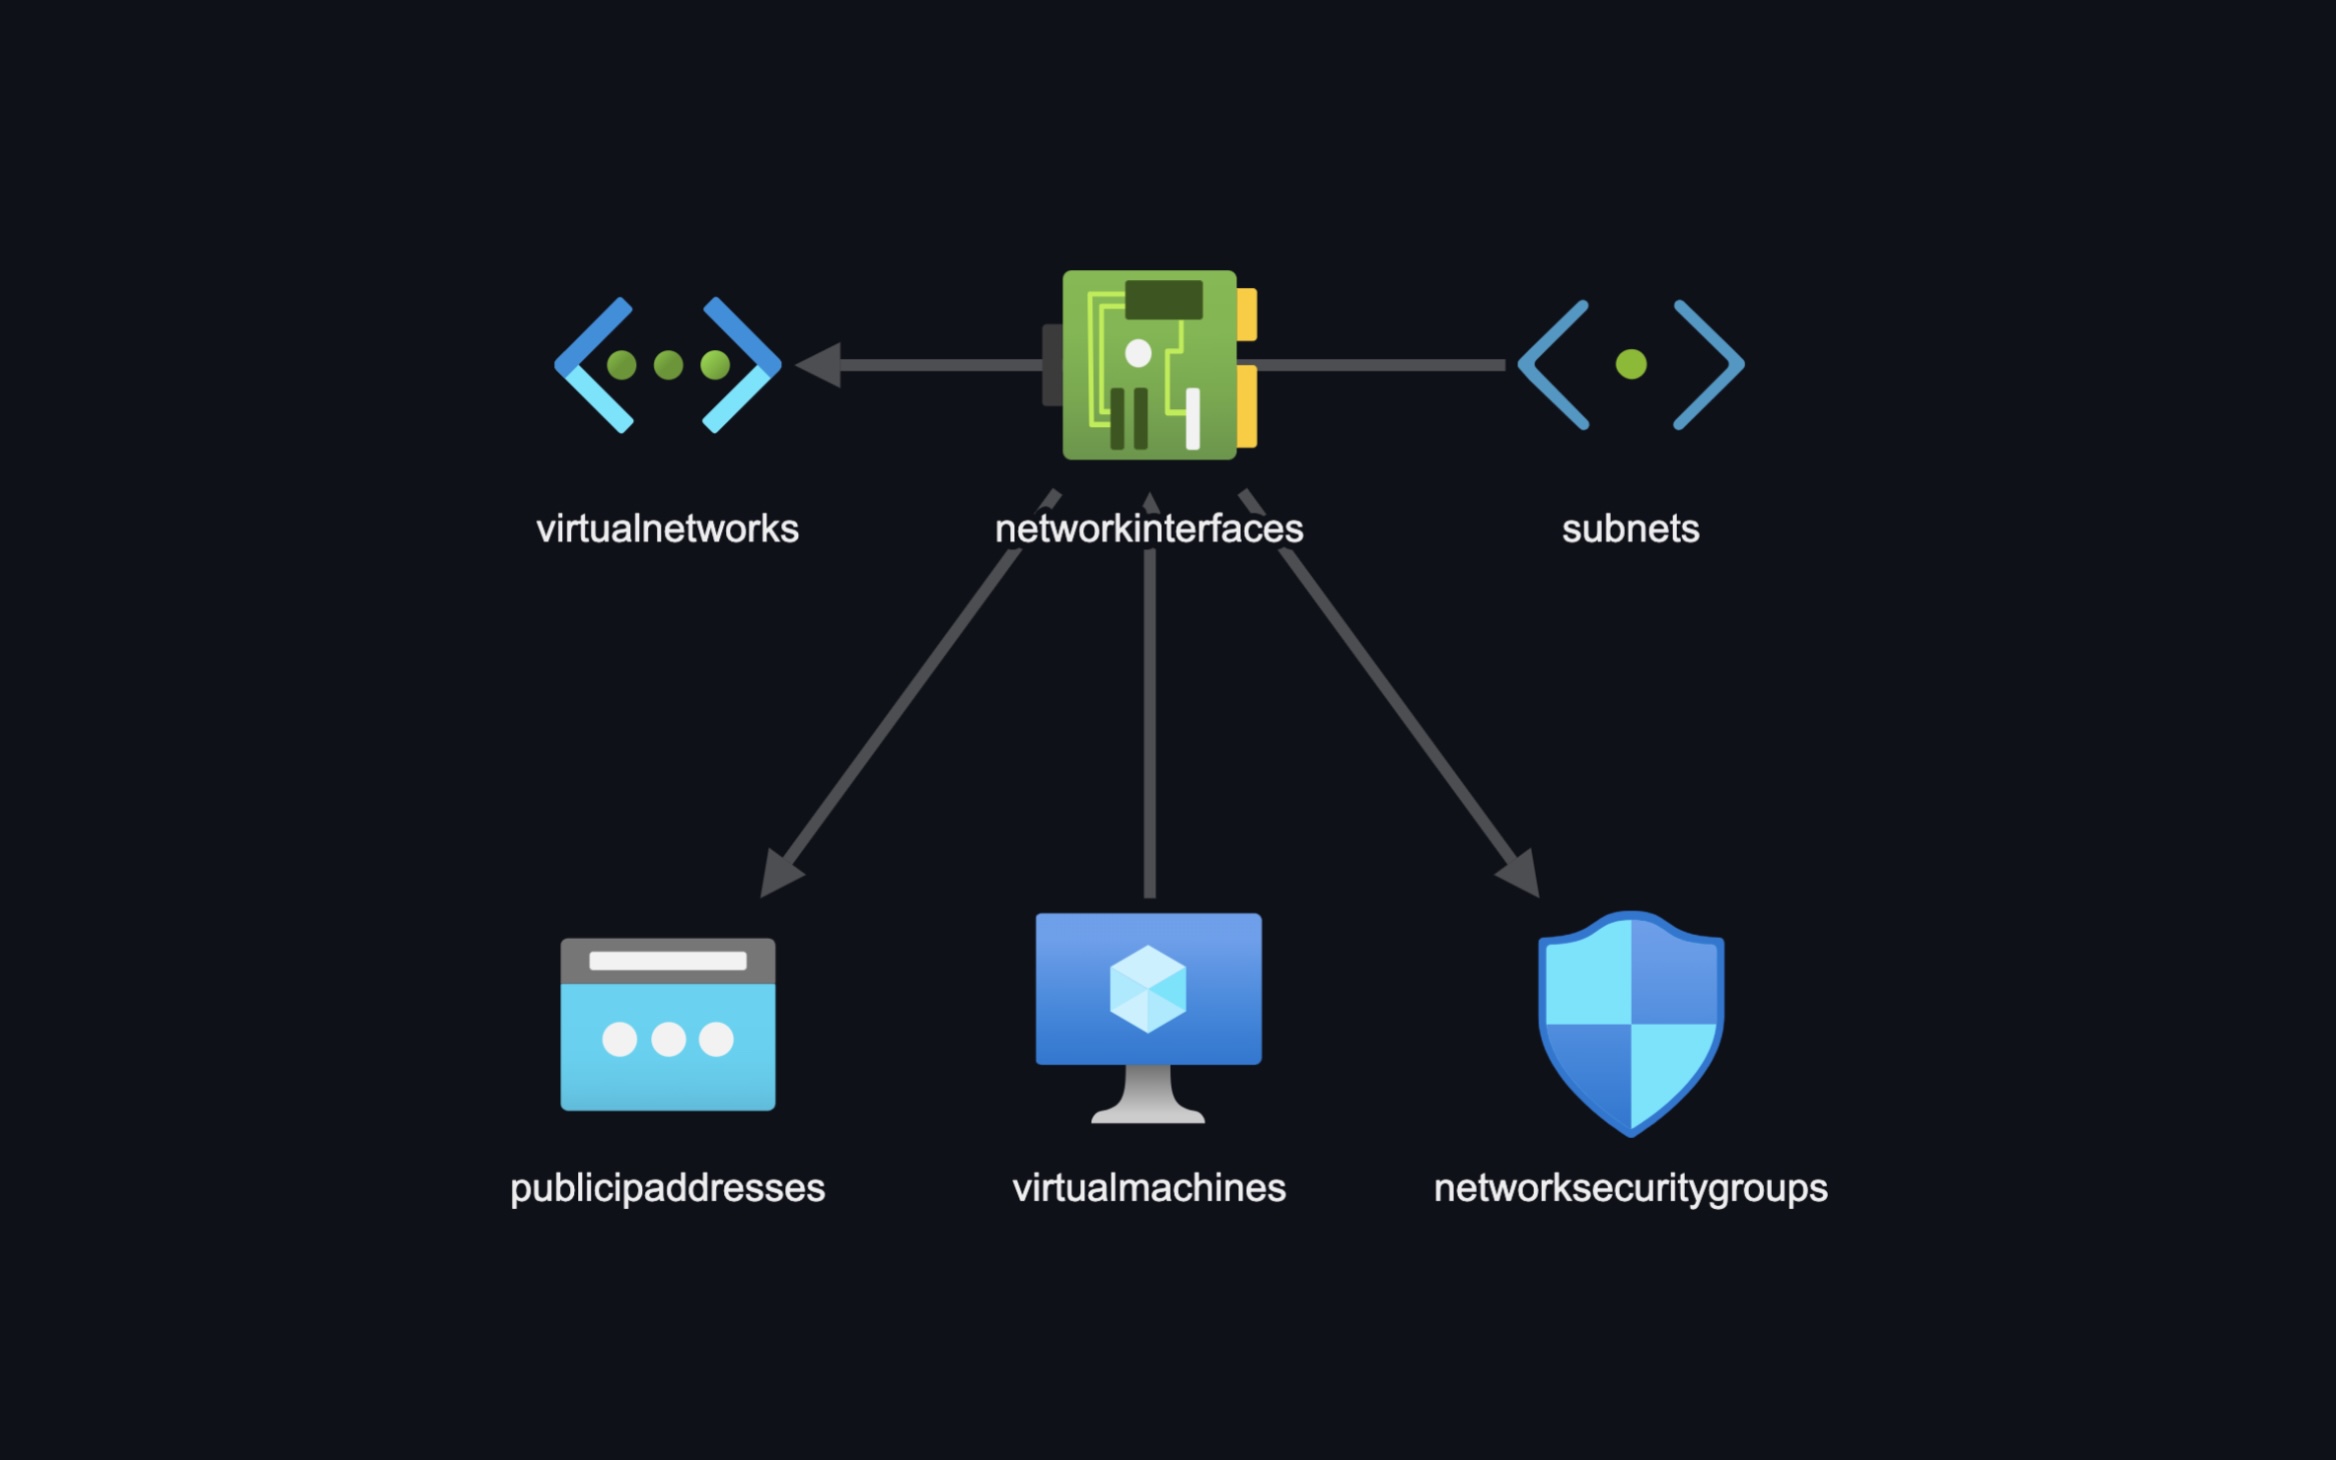
ARM template for adding an VM with a fully automated bootstrap script to create monitoring that automatically connects to Azure monitor (data source) for metrics and allows users easy viewing of key metrics for Azure resources.
Description
- Resource group
- Virtual network
- Network Interface
- Network security group
- Virtual machine
- Public IP address
- Disk
Grafana previsioned Data sources:
- Azure Monitor for getting metrics on network resources. Credentials will be with User assigned Managed Identity.
- InfluxDB data source in combination with Telegraf for getting metrics on service UpTime.
-
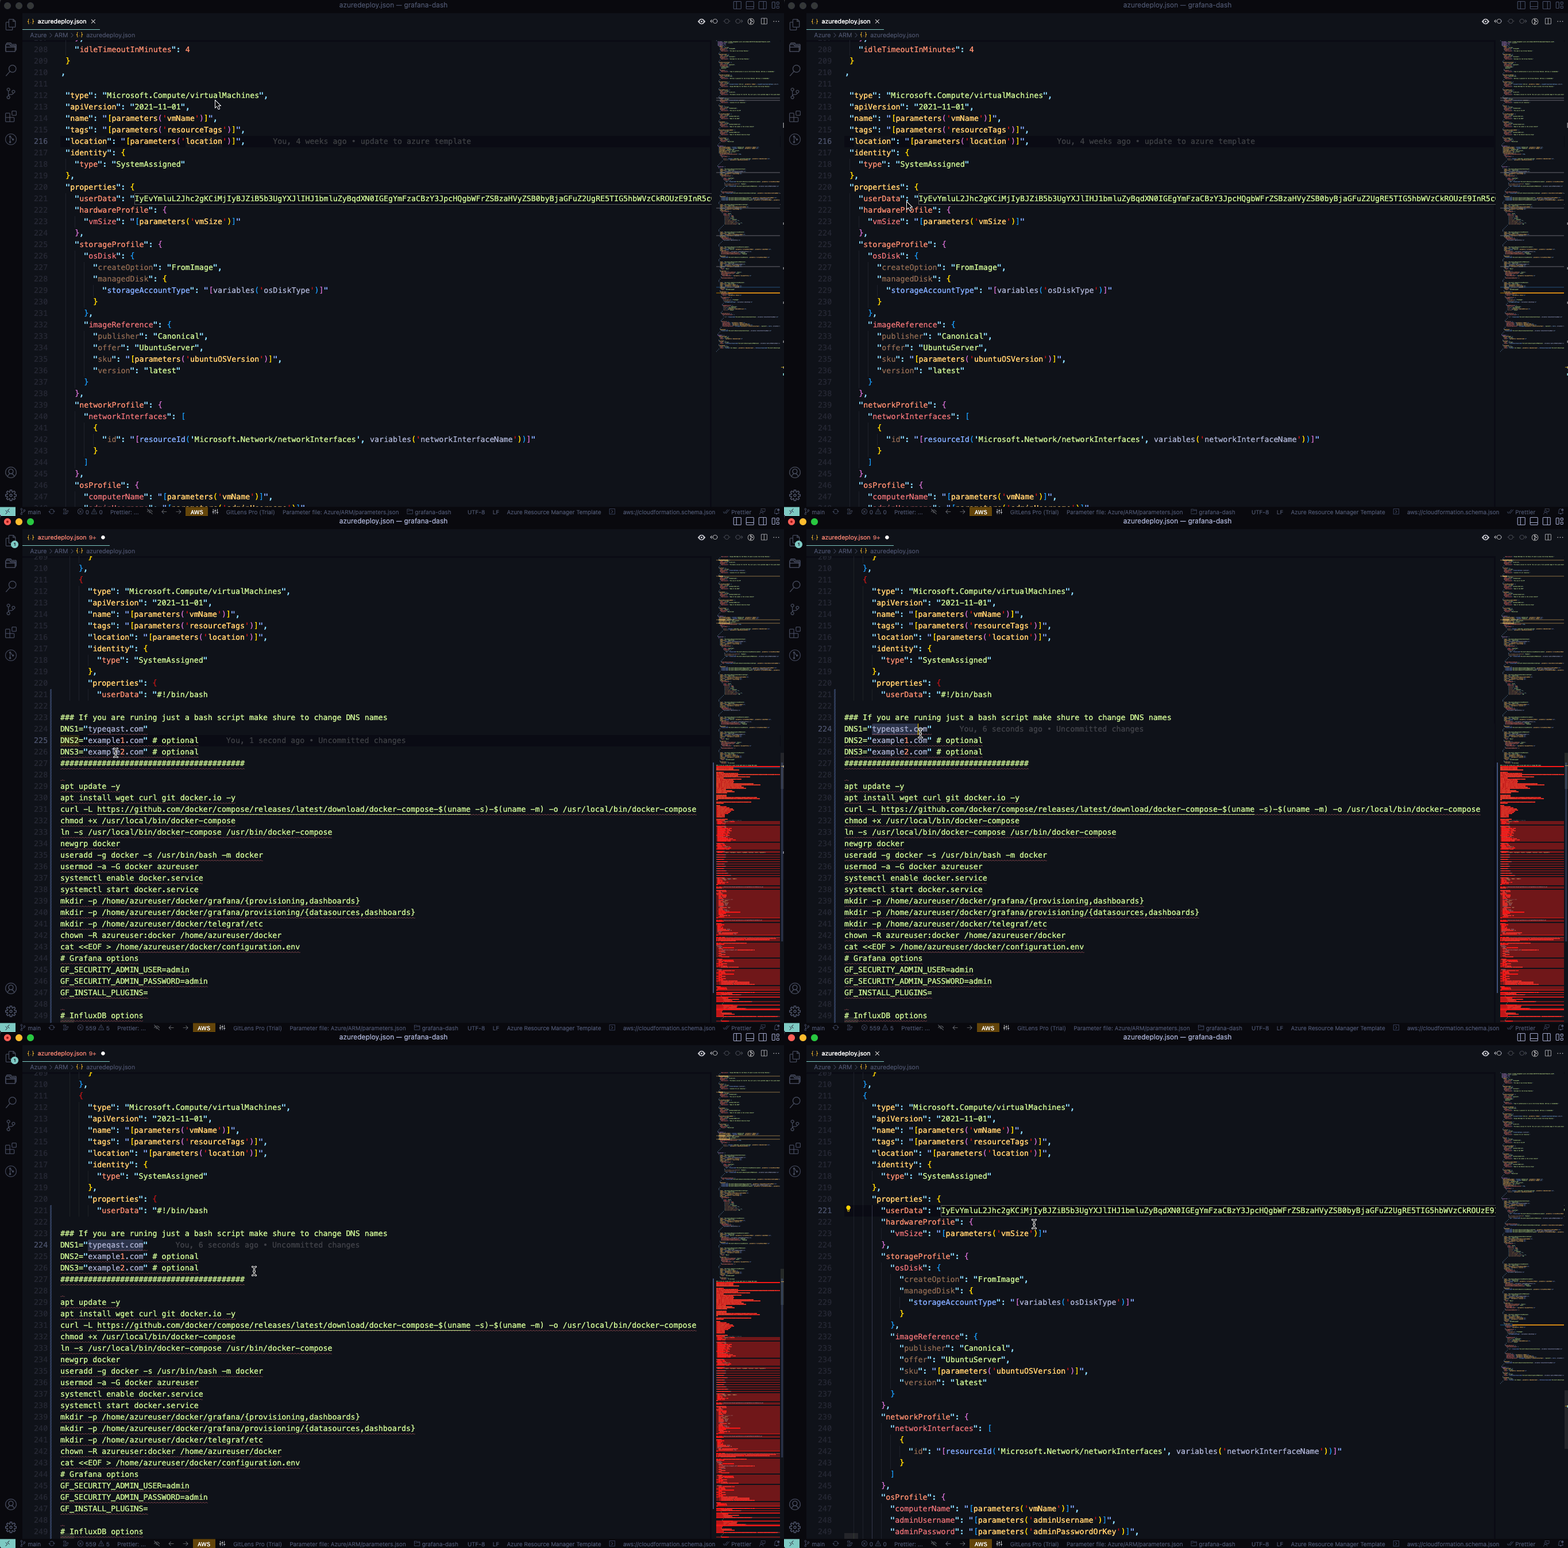
Edit UserData (bootstrap script)
Open ARM tempate (azuredeploy.json) and Base64 decode userData for VM. After editing variables for the DNS names form script encode it back to Base64.
-
Log in to Azure
az login
-
Set the right subscription
az account set --subscription "your subscription id"
-
Create the Resource group
az account list-locations

az group create --name "resource-group" --location "your location"
-
Deploy the ARM template
az group deployment create --name "name of your deployment" --resource-group "resource-group" --template-file "./azuredeploy.json"
-
In Azure CLI fill in "Linux OS Password" parameter
- At least 12 characters
- A mixture of both uppercase and lowercase letters
- A mixture of letters and numbers
- Go to portal.azure.com and add the role assignment “Monitoring Reader” to the Subscription you want to monitor.

-
Visit GrafanaVM IP address (DNS name) to access the Grafana
- User: admin
- Password: admin
Video
azure_arm_monitoring.mp4
Repository info
The maintainer for the repository: senad.dizdarevic@valcon.com If you are cloning this repository and creating a new one make sure to change the git clone command in the user-data section of the template.