


Lightweight scope-based Python profiler with colorful, hierarchical execution-time reports.
scope-timer makes it easy to find performance bottlenecks in your Python code by timing specific sections and presenting the results in a beautiful, hierarchical tree. It's designed to be simple to use and have minimal overhead.
- Simple and Intuitive API: Use decorators (
@ScopeTimer.profile_func(...)) or context managers (with ScopeTimer.profile_block(...)) to profile code blocks effortlessly. - Hierarchical Reports: Understand performance bottlenecks in nested function calls and scopes.
- Multiple Outputs: View reports directly in the console, or save them as plain text or interactive HTML files.
- Rich & Colorful: Powered by the
richlibrary for beautiful and readable terminal output. - Lightweight & Predictable: Low memory overhead and linear performance scaling, suitable for complex applications.
- Thread-Safe: Profile multi-threaded applications without interference between threads.
pip install scope-timerYou can easily profile functions and code blocks. Here is a simple example of a multi-stage pipeline:
from scope_timer import ScopeTimer
import time

@ScopeTimer.profile_func()
def preprocess():
    with ScopeTimer.profile_block("load_data"):
        time.sleep(0.01)
    with ScopeTimer.profile_block("clean_data"):
        time.sleep(0.015)

@ScopeTimer.profile_func()
def compute():
    for _ in range(10):
        with ScopeTimer.profile_block("matmul"):
            time.sleep(0.001)
        with ScopeTimer.profile_block("activation"):
            time.sleep(0.0005)

@ScopeTimer.profile_func()
def postprocess():
    with ScopeTimer.profile_block("save_results"):
        time.sleep(0.005)

# Profile the entire pipeline
with ScopeTimer.profile_block("pipeline"):
    preprocess()
    compute()
    postprocess()

# Print the summary to the console
ScopeTimer.summarize()

# You can also save the report to a file
ScopeTimer.save_html("timer_report.html")The following console output shows a structured report with elapsed time, number of calls, and percentage of parent scope.

By default, scope-timer is enabled.
If you want to completely disable timing (e.g., in production or benchmarking mode), you can set the environment variable SCOPE_TIMER_ENABLE=0.
export SCOPE_TIMER_ENABLE=0 # disables all timingThis will skip all profiling calls with near-zero overhead, making scope-timer safe to leave in production code.
Note:
The environment variable must be set before
scope_timeris imported.This is because the internal switch is initialized at import time.
To disabling in code:
import os
os.environ["SCOPE_TIMER_ENABLE"] = "0"
from scope_timer import ScopeTimerCurrently, scope-timer does not support asyncio.
This is because timer state is tracked per thread, but asyncio runs multiple tasks within a single thread, frequently switching execution contexts using await. As a result:
- Profiling an
async deffunction with@ScopeTimer.profilemay produce incorrect timing or even raiseValueError. - Using
ScopeTimer.profile(...)across anawaitboundary is not safe.
For now,
scope-timeris intended for synchronous or multi-threaded code only.
scope-timer is designed to be lightweight with predictable performance.
The following graphs show the memory usage and report generation time when profiling a realistic, multi-stage pipeline.
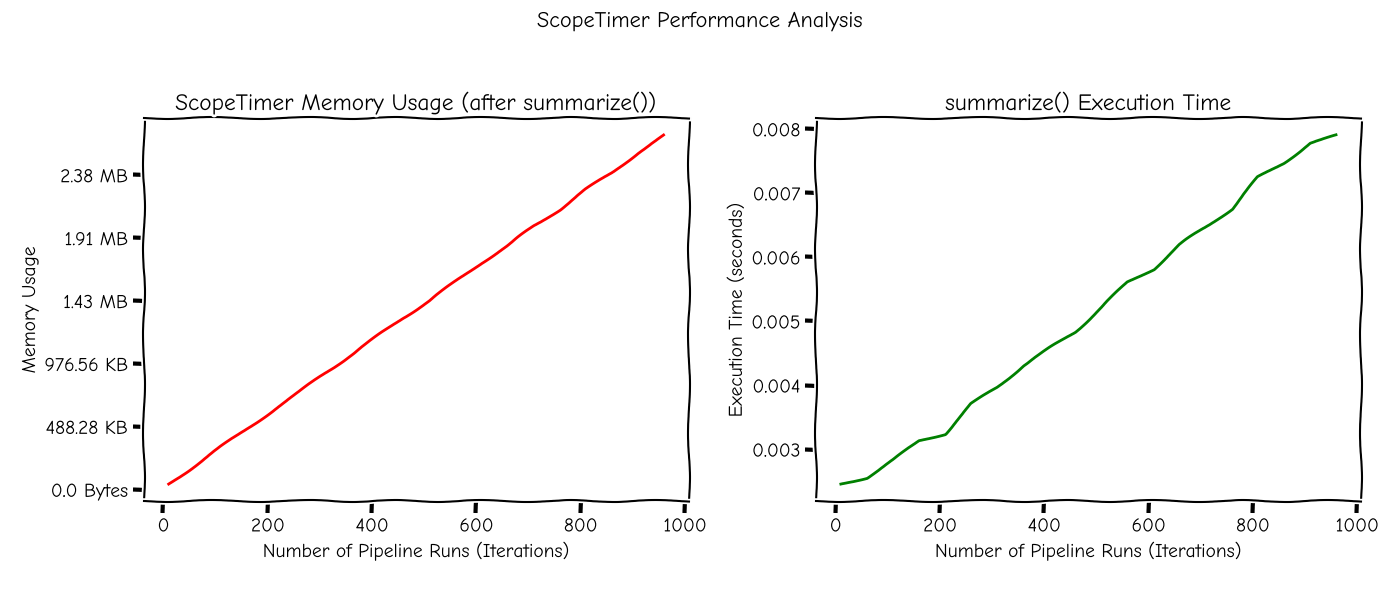
This benchmark simulates a typical pipeline structure consisting of the following:
preprocess: stage with 2 sub-taskscompute: stage with 1 sub-task and 20 repeated prediction scopespostprocess: stage with a result-saving scope
The full pipeline is executed multiple times (10–1000 iterations), and ScopeTimer.summarize() is called once at the end.
As shown:
- Memory usage increases linearly and remains well under 3MB for 1000 pipeline runs.
- Execution time for summarize() stays under 10ms for large workloads.
This ensures stable and low overhead behavior even in performance-critical applications.
All methods are static and can be called directly from the ScopeTimer class.
-
ScopeTimer.profile_block(name: str)Profiles a block of code. It can be used as a context manager (
with). It automatically handles starting and stopping the timer.Parameters:
name (str): The identifier for the scope.
-
ScopeTimer.profile_func(name: str = None)Profiles a function. It can be used as a decorator (
@). It automatically handles starting and stopping the timer.Parameters:
name (str): The identifier for the scope. If not provided, the decorated function’s name will be used automatically.
-
ScopeTimer.summarize(time_unit="auto", precision="auto", divider="rule", verbose=False)Prints a formatted summary of timing results to the console.
Parameters:
time_unit (str): The display unit for time. Can be'auto','s','ms', or'us'. Defaults to'auto'.precision (int | str): The number of decimal places for time values. Defaults to'auto'.divider (str): The style of the separator between root scopes. Can be'rule'or'blank'. Defaults to'rule'.verbose (bool): If True, displays detailed statistics (min, max, avg, var). Defaults toFalse.
-
ScopeTimer.save_txt(file_path, **kwargs)Saves a summary of timing results as a plain text file.
Parameters:
file_path (str | Path): The path to the output file.**kwargs: Accepts the same arguments assummarize()(time_unit,precision,verbose).
-
ScopeTimer.save_html(file_path, **kwargs)Saves a summary of timing results as a themed HTML file.
Parameters:
file_path (str | Path): The path to the output file.**kwargs: Accepts the same arguments assummarize()(time_unit,precision,verbose).
-
ScopeTimer.reset()Resets all recorded timer data, clearing all scopes and measurements. Use this to start a fresh set of measurements within the same process.
For a detailed history of changes, please see the CHANGELOG.md file.
This project is licensed under the MIT License.