
Lasted updated: 12/21/2021
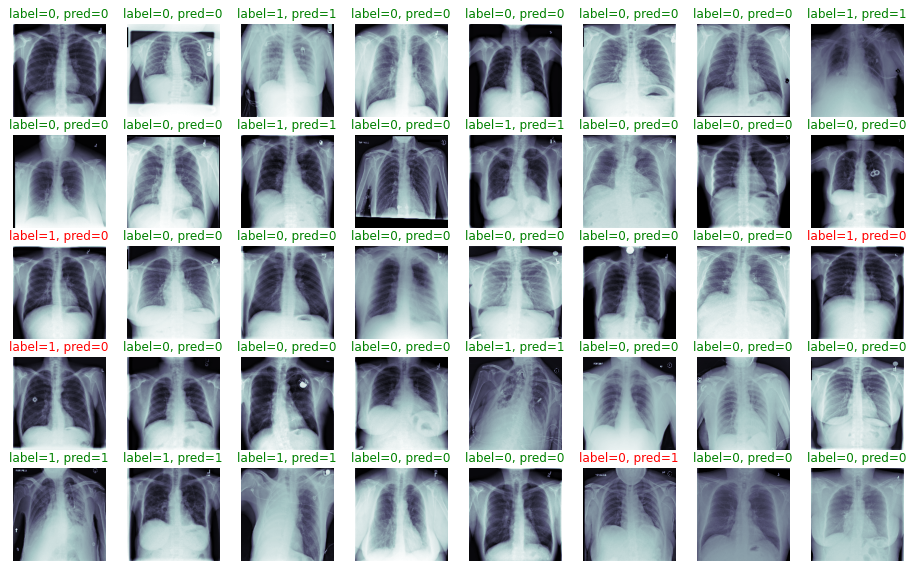
Pneumonia Detection from Chest X-Rays using convolutional neural network (images adapted from the NIH Chest X-rays dataset)
- Build a pneumonia detection AI algorithm from VGG-16 network to detect the presence of pneumonia from chest X-rays
- Model automatically checks the fields in the DICOM files on PACS and runs inference on valid X-rays
- Model achieves F1-score = 0.6197 on the validation dataset (precision = 0.6184, recall = 0.6211)
- The performance of the model is competitive with the radiologists (mean F1-score = 0.387, Reference here)
- Write up a 510(k) draft to submit for FDA approval as a computer-aided detection and diagnosis (CADe, CADx) device
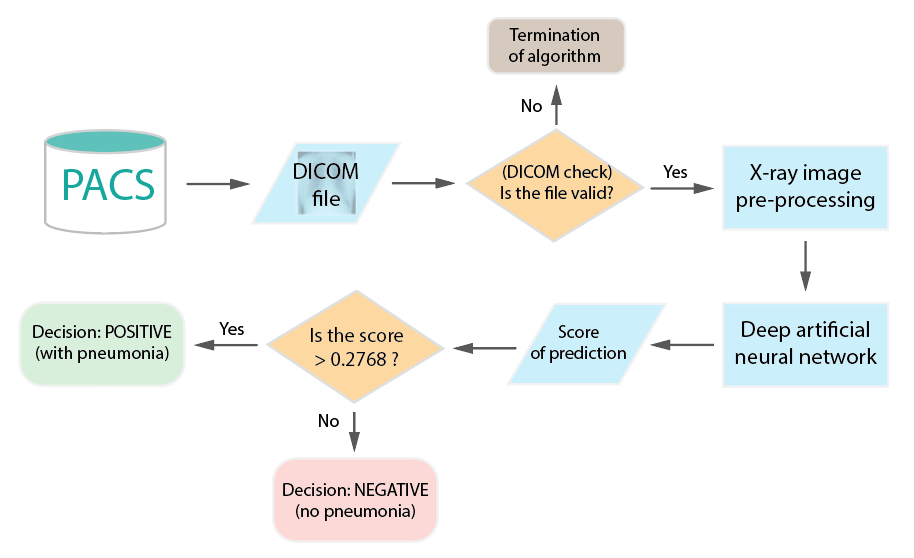
The flow chart of Pneumonia Detection AI Algorithm
Pneumonia Detection AI Algorithm uses the transfer learning technique by using a pre-trained deep convolutional neural network VGG-16 (architecture shown in the figure above, see Reference 1 for the original paper) for pneumonia classification.
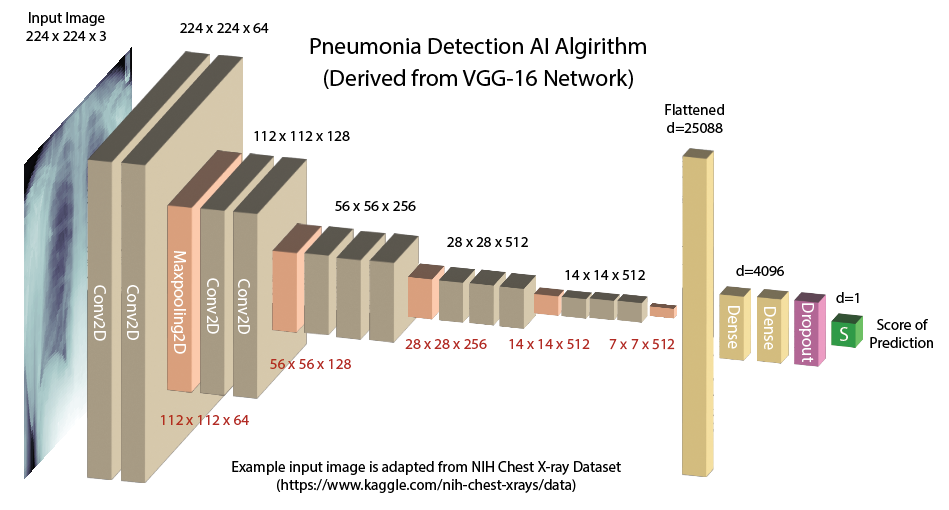
Architecture of Pneumonia Detection AI Algorithm derived from the VGG-16 network
VGG-16 network receives an input tensor of shape (224, 224, 3). The input tensor is passed through several 2-dimensional convolution layers (Conv2D) and max pooling layers (Maxpooling2D). After several layers of convolutions and max-poolings, the tensor is flattened into a 1-dimensional tensor of size 25,088 and then passed into 2 dense layers of 4,096 units. Lastly, a dense layer of size=1 with sigmoid activation function is used to produce a prediction score between 0 and 1 as the output.
Pneumonia Detection AI Algorithm is trained and validated on the NIH Chest X-rays dataset (Data_Entry_2017.csv). The dataset is downloadable on kaggle. The whole dataset consists 112,120 frontal-view X-ray images taken from 30,805 unique patients. Each image comes with a single or multiple diagnoses of findings among: 'No Finding', 'Mass', 'Infiltration', 'Consolidation', 'Edema', 'Pneumothorax', 'Hernia', 'Atelectasis', 'Pleural_Thickening', 'Pneumonia', 'Fibrosis', 'Cardiomegaly', 'Effusion', 'Nodule', and 'Emphysema'.
Pneumonia Detection AI Algorithm is intended to be used to assist the diagnosis of pneumonia. In the dataset, there are 1,426 X-rays diagnosed with pneumonia, and 110,642 X-rays that are not diagnosed with pneumonia (no pneumonia).
The dataset consists the following relevant columns: Image Index, Finding Labels, Follow-up #, Patient ID, Patient Age, Patient Gender, View Position, Original Image Size, Original Image Pixel Spacing.
The figure below summarizes the exploratory data analysis of the dataset: The age of the patients ranges from 0 yr to 100 yr (patients with age larger than 100 are removed from the dataset). 16,624 patients are male and 14,173 are female. The X-rays images consist of 44,792 anteroposterior (AP) and 67,276 posteroanterior (PA) positions. Five diseases are the most common comorbid diseases with pneumonia: infiltration (42.4%), edema (23.8%), effusion (18.7%), atelectasis (18.3%), and consolidation (8.6%). Patients with pneumonia are often diagnosed with 0-2 other comorbid diseases simultaneously.
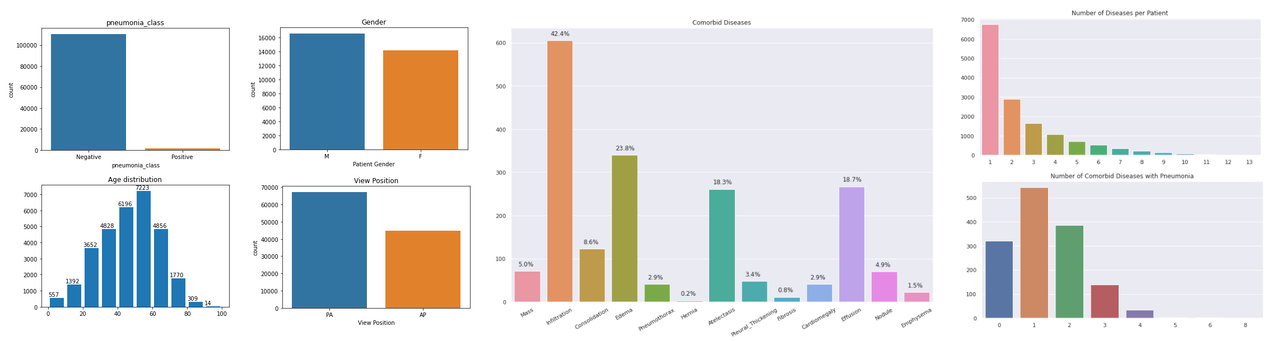
Exploratory data analysis of the NIH Chest X-rays dataset
The figure below plots the histograms of the raw pixel value data of the X-rays image in each of the findings (14 distinct diseases and images with no diseases diagnosed). For each category, 20 X-rays are sampled in random for visualization. On average, patients with pneumonia has more pixels with raw values [0-50] and less pixels with raw values [125-200].
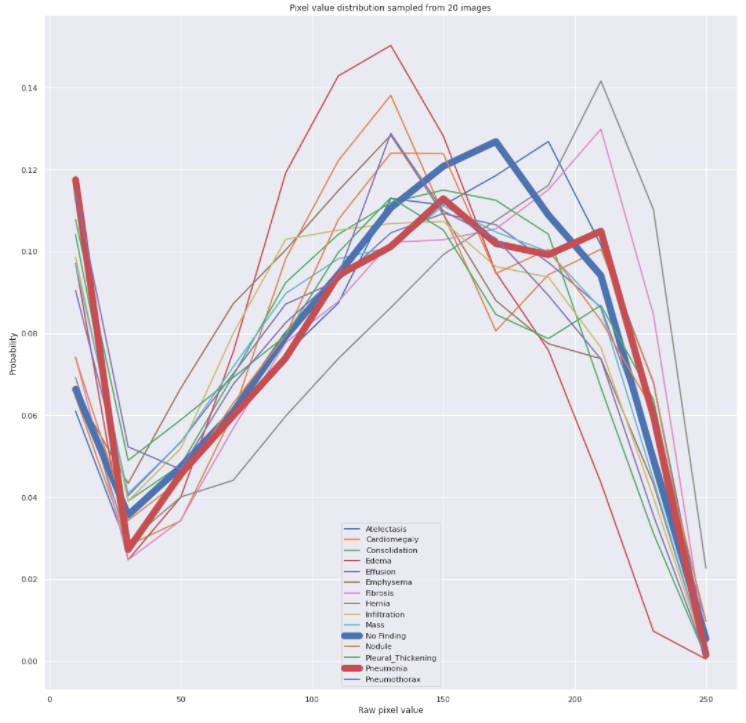
Histograms of pixel value in each finding label. Distributions of images with/without pneumonia are highlighted.
Training Dataset
The training dataset that Pneumonia Detection AI Algorithm is trained on consists of 1,910 X-rays. Among the training data, 955 images (50%) are with pneumonia, and 955 images are without pneumonia (50%).
Validation Dataset
After each epoch of training, Pneumonia Detection AI Algorithm is validated on a dataset of 2,850 X-rays. 471 images (17%) are with pneumonia, and 2,379 (83%) images are without pneumonia.
Images are chosen random from the NIH Chest X-rays dataset and separated into training and validation datasets. Care is taken so that there's not data leakage (no X-rays from the same patient exist in both training and validation datasets).
The ground truth (column Finding Labels) are obtained by a team using Natural Language Processing to text-mine the classification of the disease from the associated radiological reports (original radiology reports are not available to the public). According to the description of the dataset webpage (Reference 2), the labels are expected to be > 90% accurate.
Pneumonia Detection AI Algorithm outputs a score value in the range of [0, 1]. To convert the score into a binary result (with pneumonia / no pneumonia), a manually selected threshold is needed. Images with a score higher than the threshold will be considered as a positive result (with pneumonia), while images with a score smaller than (or equal to) the threshold will be concluded as a negative result (without pneumonia). A small threshold will yield more false positive results (FP), resulting in a low precision, defined as TP/(TP+FP). On the other hand, a large threshold will yield more false negative (FN) results, resulting in a low recall, defined as TP/(TP+FN).
Precision = True Positive / (True Positive + False Positive) = TP / (TP+FP)
Recall = True Positive / (True Positive + False Negative) = TP / (TP + FN)
By tuning the threshold from 0 to 1 on the prediction scores made on the validation dataset, Pneumonia Detection AI Algorithm gives the precision-recall curve shown below. Higher threshold gives better precision but worse recall, and lower threshold gives better recall but worse precision.
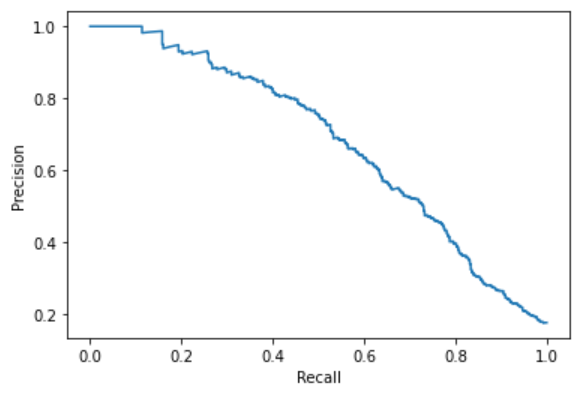
Precision-recall curve of Pneumonia Detection AI Algorithm on the validation dataset
Pneumonia Detection AI Algorithm provide a compromise between precision and recall by selecting the threshold to maximize the F1-score, which is defined by 2*precision*recall / (precision + recall). The figure below shows the value of the F1-score as a function of the threshold on the validation dataset. The F1-score reaches the maximum (F1=0.6197) when the threshold is 0.2768. As a result, Pneumonia Detection AI Algorithm uses 0.2768 as the threshold to make the binary decision (with pneumonia or no pneumonia). This manually selected threshold gives 0.6184 precision and 0.6211 recall.
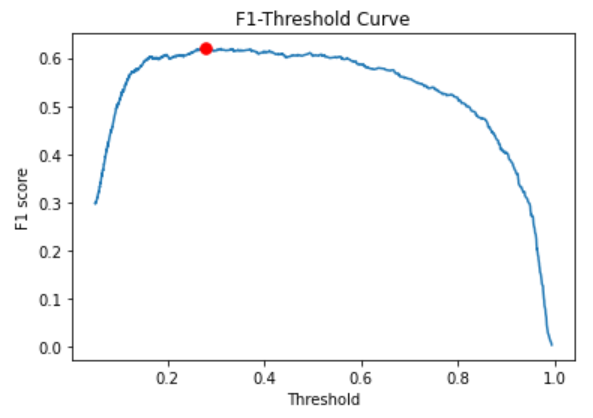
F1-score as a function of the threshold on the validation dataset. The threshold is chosen to be 0.2768 to maximize the F1-score
With a balanced precision and recall, Pneumonia Detection AI Algorithm is intended to be used as a computer-aided detection and diagnosis device to assist qualified healthcare professionals to make diagnosis or screen the patients for worklist prioritization.