
A tag cloud, otherwise known as a word cloud or weighted list, is a visual representation of text data. This chart is typically used to show keyword metadata (tags) on websites, or to visualize free form text. Tags are usually single words, and the importance of each tag, which is often based on its frequency, is shown with font size or color. This has been inspired by anychart.
Demo Application: https://apex.oracle.com/pls/apex/f?p=133110:9999::BRANCH_TO_PAGE_ACCEPT::9999:P9999_APP_PAGE_REDIRECT:2
DB versions: 12.1.0.1,12.2.0.1,18.4.0.0,19.0.0.0.0,19.2.0.0.19,21.0.0.0.0,21.1.0.0.0,21.1.0.0.1
APEX versions 20.1.0.00.13,20.2.0.00.20,21.1.0
Export plugin file "region_type_plugin_orclking_tag_cloud.sql" from Source directory and import it into your application.
Step 1: Export a script "Script to Populate Sample Data.sql" from directory and compile it in your schema.
Step 2: Create a new blank page.
Step 3: Export plugin file "region_type_plugin_orclking_tag_cloud.sql" from Source directory and import it into your application.
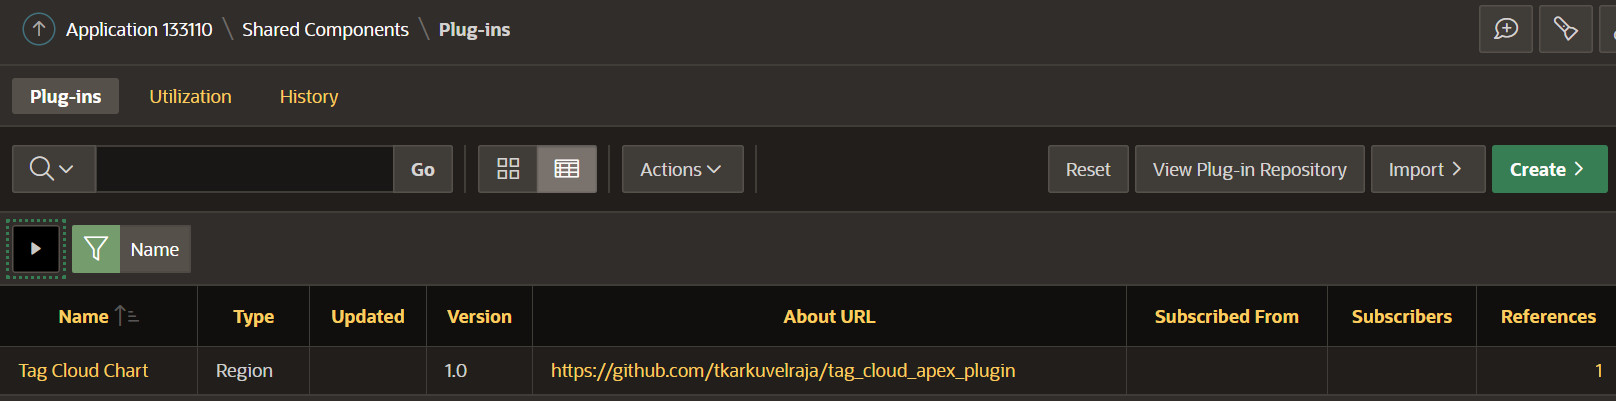
Navigation: Shared Components ==> Plug-ins ==> Import

Plugin will be listed under plug-ins bucket after successful installation.
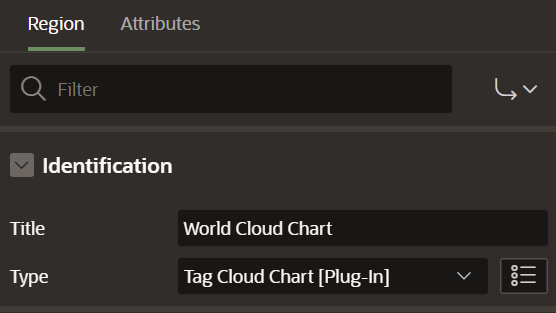
Step 4: Create a region to the page. Change region type to Tag Cloud Chart [Plug-In].
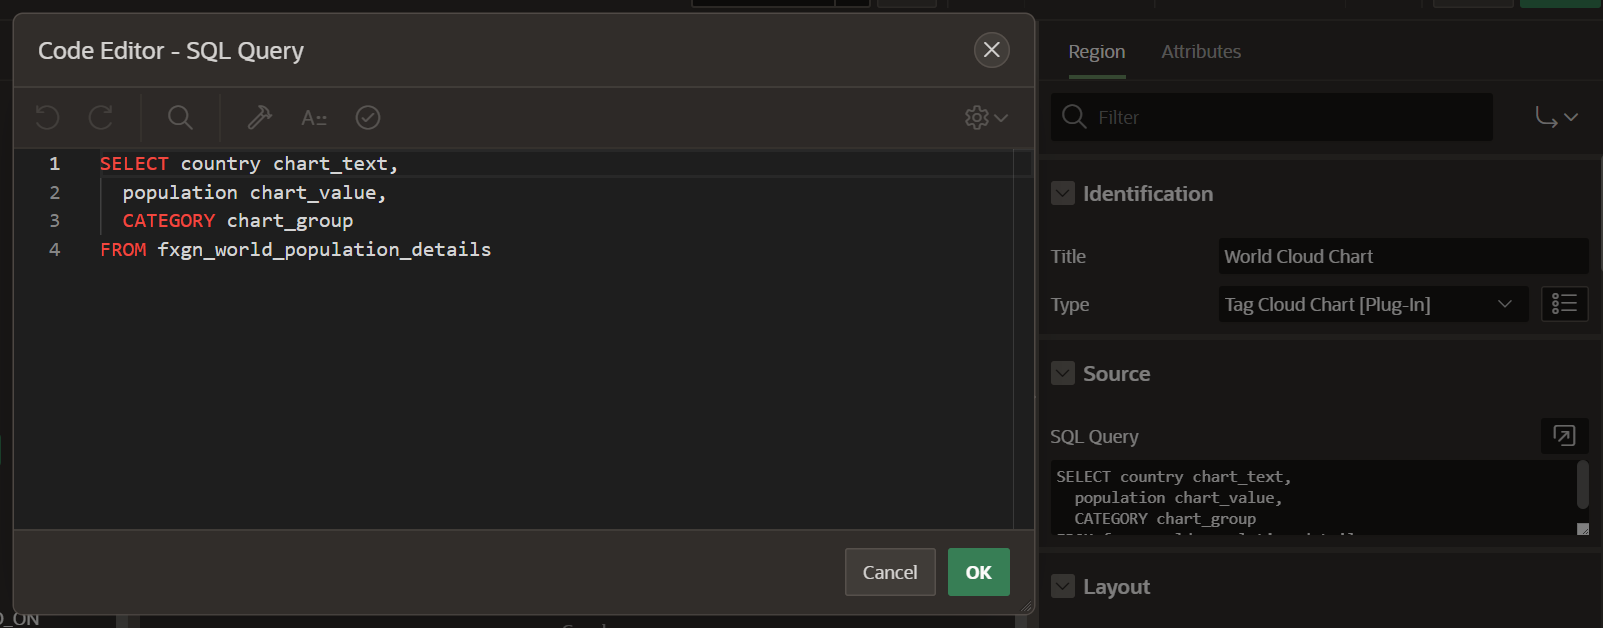
Step 5: Construct Oracle SQL query and copy and paste it in region SQL Query section.
Query Template:
SELECT 'India' chart_text,

       1000000000 chart_value,

       'asia' chart_group

  FROM dual

 WHERE 1 = 1;
Sample Query to Render a Report:
Note: Populate sample data by exporting a script "Script to Populate Sample Data.sql" from directory and compile it in your schema.
SELECT country AS chart_text,

       population AS chart_value,

       category AS chart_group

  FROM fxgn_world_population_details;
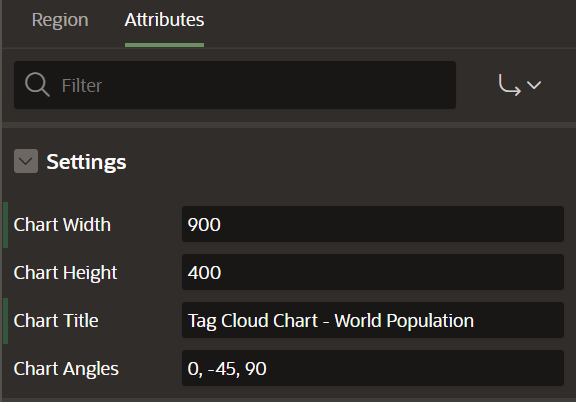
Step 6: Fill required attributes
Output: Then you output would display like this,
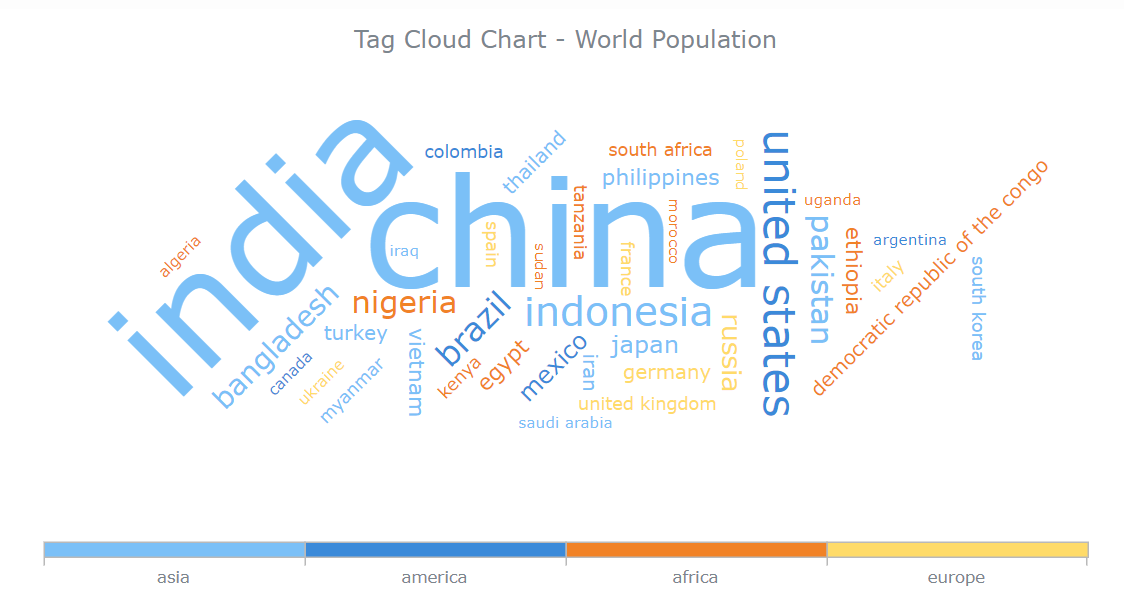
That's it.
Happy APEXing!!!...